
Checkmate Uptime & Infrastructure Monitoring on AWS User Guide
Overview
Checkmate, by BlueWave Labs, is an open source uptime, infrastructure and incident monitoring platform. It continuously checks the availability and response time of your websites, HTTP APIs, TCP ports, ping targets and DNS records, and presents their status, uptime percentage and response time history in a clean React dashboard backed by a REST API. Add a monitor for each endpoint you care about, set the check interval, and Checkmate records every result so you see current status at a glance, track incidents and publish status pages.
This image runs Checkmate bare metal behind nginx. The Node.js and Express server is built from the pinned upstream release and reverse proxied by nginx on port 80, and the React client is served as a static bundle by the same nginx. All monitoring data is stored in a local MongoDB 8.0 on a dedicated EBS data volume, with the database bound to the loopback interface. The check queue is MongoDB backed, so there is no separate Redis to run.
A single administrator account, a fresh JWT signing secret and a fresh MongoDB password are generated on the first boot of every deployed instance. Two instances launched from the same Amazon Machine Image never share credentials. The administrator email and password are written to /root/checkmate-credentials.txt with mode 0600 so that only the root user can read them. Self registration closes after that first administrator account is created, so the dashboard is never left open. No monitors and no shared credentials ship in the image.
The MongoDB database lives under /var/lib/mongodb on a dedicated EBS volume separate from the operating system disk, so monitoring data can be resized and snapshotted independently.
Prerequisites
Before you deploy this image you need:
- An Amazon Web Services account where you can launch EC2 instances
- IAM permissions to launch instances, create security groups, and subscribe to AWS Marketplace products
- An EC2 key pair in the target Region for SSH access to the instance
- A VPC and subnet in the target Region, with a security group allowing inbound port 22 from your management network and inbound ports 80 and 443 from the networks your users will reach Checkmate on
- The AWS CLI (version 2) installed locally if you plan to deploy from the command line
Step 1: Launch the Instance from the AWS Marketplace
- Open the product page in the AWS Marketplace and choose Continue to Subscribe, then Continue to Configuration.
- Select the software version and the Region you want to deploy in, then Continue to Launch.
- Choose an instance type. The recommended type is m5.large; you can start smaller to evaluate and scale up as your monitor count grows.
- Select your VPC, subnet and key pair, and attach a security group that allows inbound 22 from your management network and inbound 80 (and optionally 443) from your users.
- Launch the instance and wait for its status checks to pass.
Step 2: Launch the Instance from the AWS CLI
You can also launch the AMI directly. Replace the AMI id with the one shown on the Marketplace listing for your Region, and supply your own key pair, subnet and security group ids.
aws ec2 run-instances \
  --image-id ami-0123456789abcdef0 \
  --instance-type m5.large \
  --key-name my-key-pair \
  --subnet-id subnet-0123456789abcdef0 \
  --security-group-ids sg-0123456789abcdef0 \
  --metadata-options "HttpTokens=required" \
  --tag-specifications 'ResourceType=instance,Tags=[{Key=Name,Value=checkmate}]'
The instance uses IMDSv2; the first boot service reads the instance's public address from instance metadata to configure the dashboard's client host automatically.
Step 3: Connect and Retrieve Initial Credentials
Connect over SSH as the default login user for your operating system variant. On the Ubuntu variant that user is ubuntu.
Connecting to your instance
| OS variant | SSH login user |
|---|---|
| Ubuntu 24.04 LTS | ubuntu |
ssh -i my-key-pair.pem ubuntu@<instance-public-ip>
The administrator credentials are generated on first boot and written to a root only file. Retrieve them with:
sudo cat /root/checkmate-credentials.txt
The file contains the dashboard URL, the administrator email and the per instance password:
CHECKMATE_URL=http://<instance-public-ip>/
CHECKMATE_ADMIN_EMAIL=admin@checkmate.local
CHECKMATE_ADMIN_PASSWORD=<your-per-instance-password>
Step 4: First Login to the Checkmate Web Interface
Browse to http://<instance-public-ip>/ and sign in with the email and password from the credentials file.
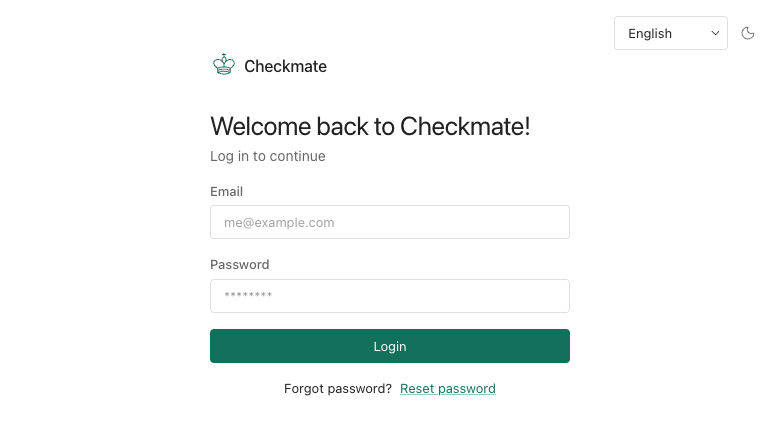
The Checkmate sign-in page, served on first boot with a per-instance administrator password and self registration closed after the first account.
You can confirm the service is healthy from the instance itself. The dashboard is served on port 80, the Node server answers a health endpoint, and requests without a valid token are rejected:
# The React sign-in page is served on port 80 (200)
curl -s -o /dev/null -w 'GET / -> HTTP %{http_code}\n' http://127.0.0.1/

# The Checkmate server health endpoint returns OK (200)
curl -s http://127.0.0.1/api/v1/health

# An unauthenticated write to the API is rejected (401)
curl -s -o /dev/null -w 'POST /api/v1/monitors (no auth) -> HTTP %{http_code}\n' \
  -X POST http://127.0.0.1/api/v1/monitors -H 'Content-Type: application/json' -d '{}'
GET / -> HTTP 200
{"status":"OK"}
POST /api/v1/monitors (no auth) -> HTTP 401
Step 5: Create Your First Monitor
From the Uptime dashboard choose Create and select the type of check to perform. Checkmate can monitor HTTP(S) endpoints, ICMP ping, Docker containers, TCP ports, game servers, gRPC services, WebSocket endpoints and DNS.
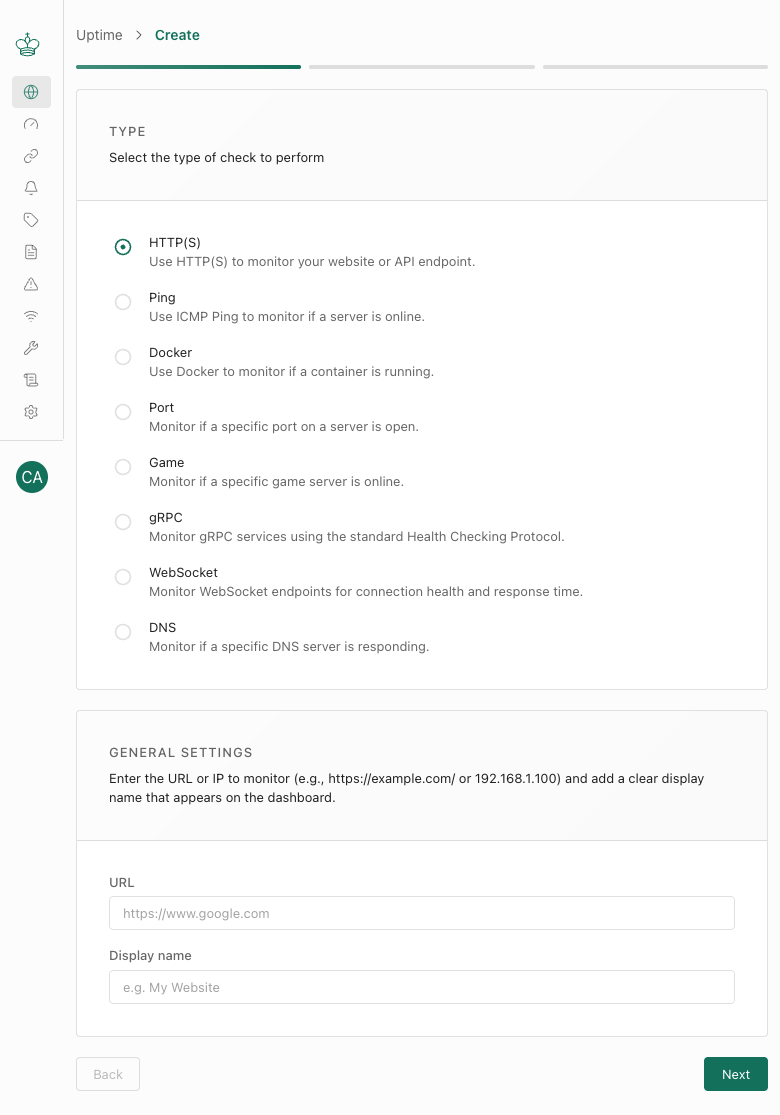
Adding a new monitor: choose an HTTP, ping, port, Docker, DNS, gRPC or WebSocket check, enter the URL or address to watch and give it a display name.
Enter the URL or IP to monitor, give it a clear display name, set the check interval, and save. Each result is recorded so you build up an uptime percentage and a response time history for every target.
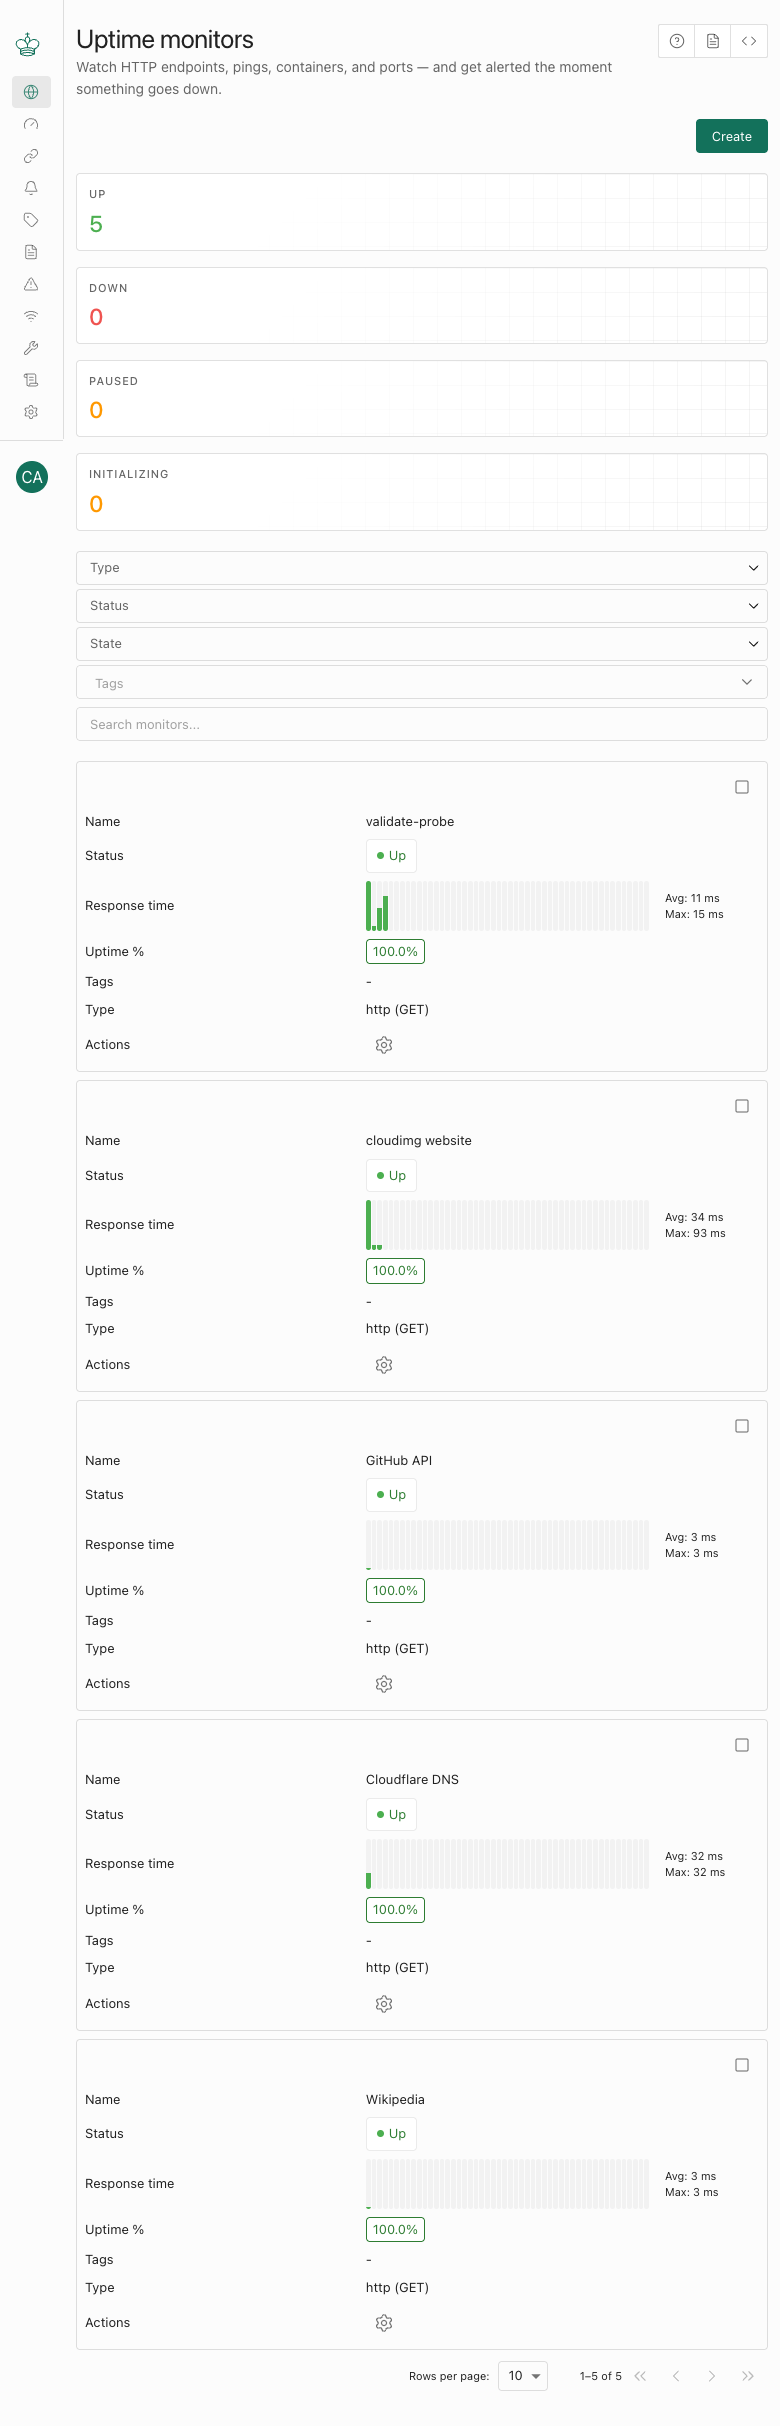
The uptime monitors dashboard showing monitored websites and endpoints, each with its status, response time trend and uptime percentage, plus up, down and paused counts at the top.
Step 6: Read a Monitor's Detail
Click any monitor to open its detail view. It shows the current status, how long the monitor has been active, the last check and response time, the monitored certificate's expiry for HTTPS targets, uptime and downtime counts, an average response time gauge, a response time chart, and the log of recent checks with their status codes.
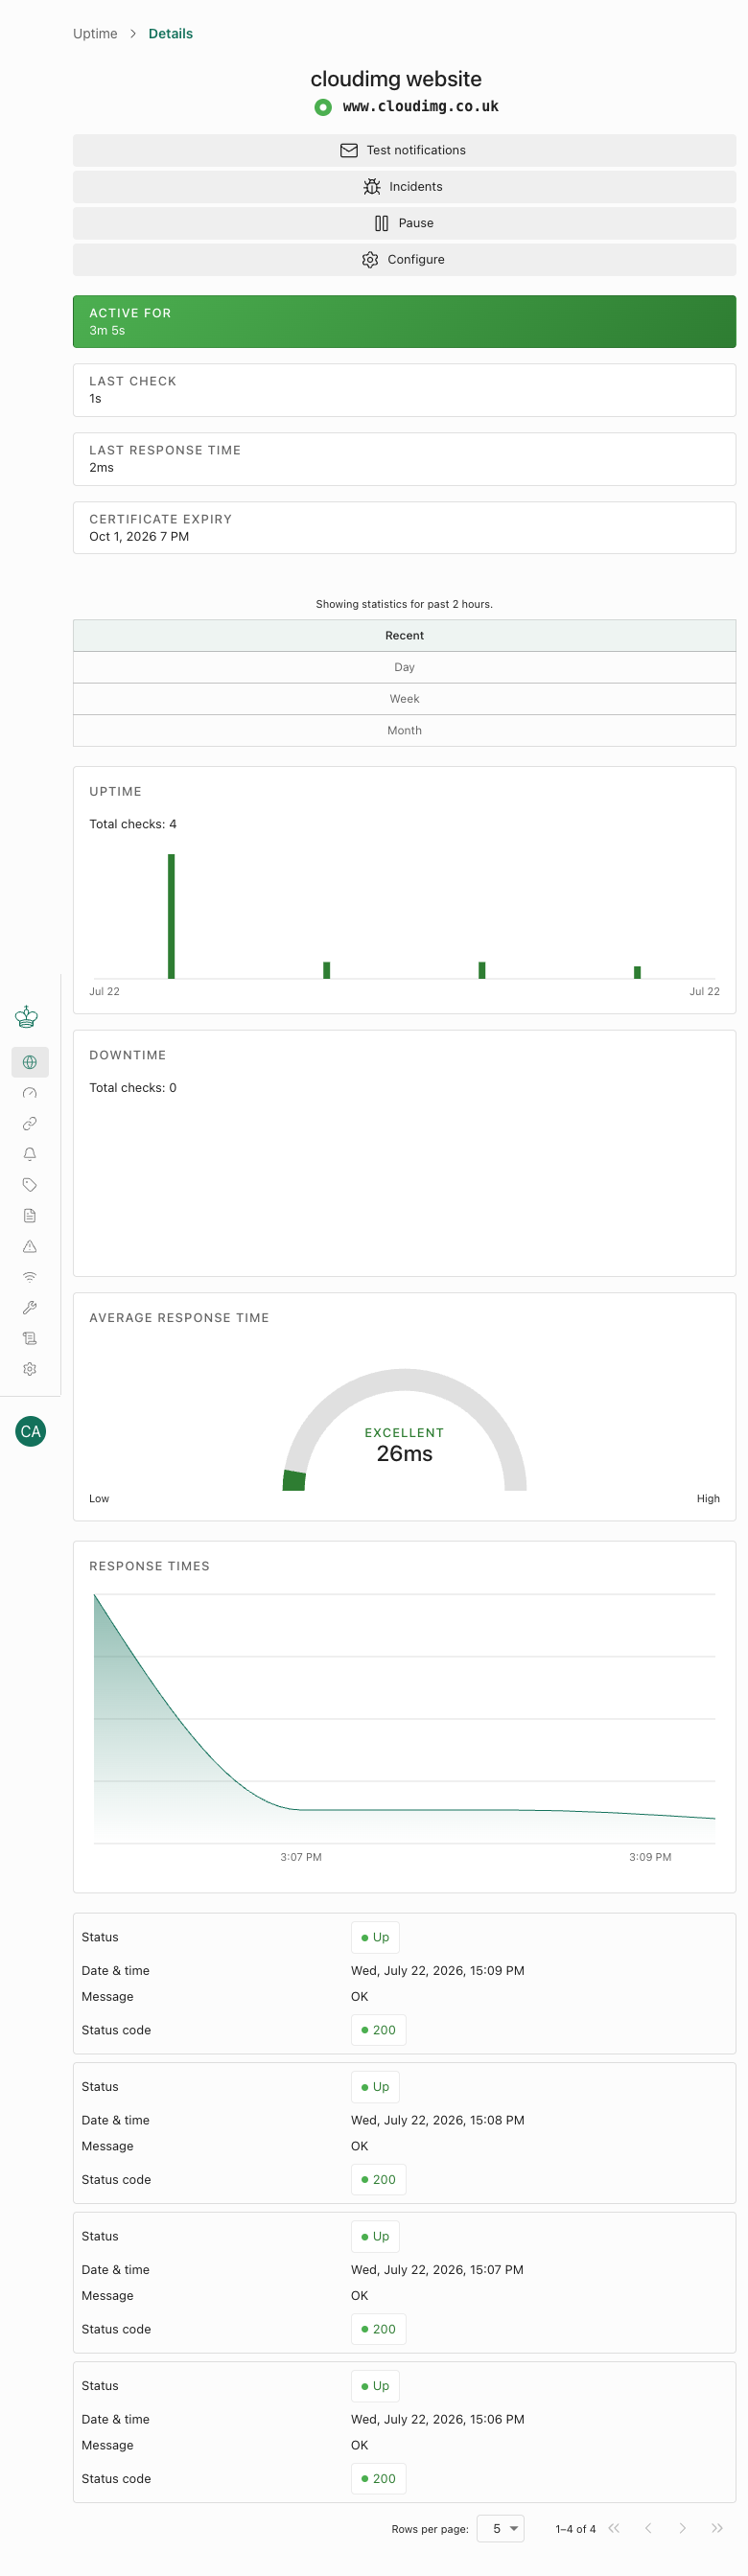
A single monitor's detail view with its status, uptime and downtime history, average response time, response time chart, certificate expiry and recent check log.
Step 7: Notifications, Incidents and Status Pages
Use Notifications to wire alerts to your channels so you are told the moment a monitor changes state, Incidents to review outages, and Status pages to publish a public or internal status page for your services. Invite additional team members from Settings; self registration is closed after the first administrator, so new users join by invitation only.
Step 8: Services and Operations
The appliance runs three systemd services. You can inspect and manage them with systemctl:
systemctl status mongod       # MongoDB 8.0, bound to loopback, data on /var/lib/mongodb
systemctl status checkmate    # the Checkmate Node.js server on 127.0.0.1:52345
systemctl status nginx        # serves the React client and reverse-proxies /api on port 80
All three run locally, and only nginx is network facing:
sudo ss -tlnp | grep -E ':80 |:52345 |:27017 '
LISTEN 127.0.0.1:27017    # MongoDB — loopback only
LISTEN 127.0.0.1:52345    # Checkmate Node server — loopback only
LISTEN 0.0.0.0:80         # nginx — the only public listener
MongoDB is bound to 127.0.0.1 and is never reachable from outside the instance; the Node server is also loopback only, reachable only through the nginx reverse proxy.
Step 9: Enable HTTPS
The image serves the dashboard over HTTP on port 80, and port 443 is available in your security group for you to add TLS. To terminate HTTPS with your own certificate, place your certificate and key on the instance, add a listen 443 ssl; server block to the nginx site at /etc/nginx/sites-available/cloudimg-checkmate referencing them (keeping the existing /api/ reverse proxy and SPA fallback), then set CLIENT_HOST in /etc/checkmate/checkmate.env to your https:// address and restart the service:
sudo nano /etc/checkmate/checkmate.env      # set CLIENT_HOST=https://your-domain
sudo nginx -t && sudo systemctl reload nginx
sudo systemctl restart checkmate
For a public domain, a certificate from Let's Encrypt via certbot is the simplest option. Our support team can help you configure TLS termination.
Step 10: Backups and Maintenance
All monitoring data lives in MongoDB under /var/lib/mongodb on a dedicated EBS volume. Snapshot that volume for point in time backups, and use mongodump for logical backups:
sudo mongodump --uri "$(sudo awk -F= '/^DB_CONNECTION_STRING=/{sub(/^DB_CONNECTION_STRING=/,"");print}' /etc/checkmate/checkmate.env)" --out /var/backups/checkmate-$(date +%F)
To upgrade the appliance's operating system packages, use sudo apt-get update && sudo apt-get upgrade. For Checkmate application upgrades, contact cloudimg support.
Step 11: Growing Your Deployment
Start on a small instance type to evaluate, and scale up as your monitor count grows. Because monitoring data is on its own EBS volume, you can grow storage independently of the operating system disk, and snapshot or migrate it without touching the application.
Support
cloudimg provides 24/7/365 expert technical support for this image. Guaranteed response within 24 hours, one hour average for critical issues. Contact support@cloudimg.co.uk.