Cloudprober Active Black Box Monitoring on AWS User Guide
Overview
Cloudprober is an open source, active monitoring tool that answers one question continuously: are my services actually working, and how fast. Instead of waiting for a customer to report an outage, Cloudprober keeps probing your endpoints on a schedule over HTTP, HTTPS, PING, DNS, TCP, gRPC and external commands, and turns the results into availability and latency time series you can alert on. It is built for black box, prober style monitoring: you describe the targets and the probes, and Cloudprober measures reachability, success ratio and latency from the vantage point of this instance.
The cloudimg image installs Cloudprober as a single static Go binary and puts it behind nginx. Cloudprober's own HTTP server has no authentication of its own, so this image never exposes it: the built in status page and Prometheus metrics endpoint are pinned to 127.0.0.1:9313, and nginx on port 443 is the only network facing surface. nginx terminates TLS and enforces HTTP basic authentication that is generated uniquely on each instance's first boot, so no credential is baked into the image and no two instances share one. A separate unauthenticated health endpoint is available for load balancer probes.
What is included:
- Cloudprober single static Go binary (
/opt/cloudprober/cloudprober), installed from the official upstream release and checksum verified at build time - Textproto configuration at
/etc/cloudprober.cfgwith a Prometheus surfacer enabled cloudprober.servicerunning as the dedicated non rootcloudproberuser, bound to loopback127.0.0.1:9313nginx.serviceterminating TLS on port 443 and fronting the whole monitoring surface with HTTP basic authenticationcloudprober-firstboot.servicegenerating a unique per instance basic authentication credential and a per instance self signed TLS certificate on first boot- A demo probe (
cloudimg_selfcheck) that reports success out of the box, so metrics flow the moment the instance boots - An unauthenticated
/healthzendpoint for load balancer and liveness probes - Ubuntu 24.04 LTS base, latest patches, unattended security upgrades enabled
- 24/7 cloudimg support
Prerequisites
Before you deploy this image you need:
- An Amazon Web Services account where you can launch EC2 instances
- IAM permissions to launch instances, create security groups, and subscribe to AWS Marketplace products
- An EC2 key pair in the target Region for SSH access to the instance
- A VPC and subnet in the target Region, with a security group allowing inbound port 22 from your management network and inbound port 443 from the networks you will reach the status page from
- The AWS CLI (version 2) installed locally if you plan to deploy from the command line
Connecting to your instance
Connect over SSH on port 22 as the default login user for the operating system variant you launched. This listing currently ships the following variant:
| OS variant | SSH login user |
|---|---|
| Ubuntu 24.04 LTS | ubuntu |
The status page and metrics are served on port 443 through nginx (Cloudprober itself listens only on 127.0.0.1:9313).
Step 1: Launch the Instance from the AWS Marketplace
Sign in to the AWS Management Console, open the EC2 service, and select Launch instance. Under Application and OS Images choose AWS Marketplace AMIs and search for Cloudprober. Select the cloudimg listing and choose Select, then Continue on the subscription summary.
Pick an instance type of m5.large or larger (Cloudprober is very light, but m5.large is the tested recommendation). Choose your EC2 key pair under Key pair (login). Under Network settings select your VPC and subnet, and either create or select a security group that allows inbound port 22 from your management network and inbound port 443 from the networks you will reach the status page from. Leave the root volume at the default size or larger.
Select Launch instance. First boot initialisation takes under a minute after the instance state becomes Running and the status checks pass.
Step 2: Launch the Instance from the AWS CLI
The following block launches an instance from the cloudimg Cloudprober Marketplace AMI into an existing subnet and security group. Replace <ami-id> with the AMI ID shown on the Marketplace listing, <key-name> with your EC2 key pair name, <subnet-id> with your subnet ID, and <security-group-id> with a security group that opens ports 22 and 443 as described above.
aws ec2 run-instances \
  --image-id <ami-id> \
  --instance-type m5.large \
  --key-name <key-name> \
  --subnet-id <subnet-id> \
  --security-group-ids <security-group-id> \
  --metadata-options "HttpTokens=required,HttpEndpoint=enabled" \
  --tag-specifications 'ResourceType=instance,Tags=[{Key=Name,Value=cloudprober}]'
The image resolves this instance's public address on first boot using the EC2 Instance Metadata Service (IMDSv2), so it works with HttpTokens=required enabled. That address becomes the common name and a subject alternative name on the per instance TLS certificate.
Step 3: Connect via SSH
Connect as the ubuntu user (see the Connecting to your instance table above for other variants).
ssh ubuntu@<public-ip>
The message of the day prints the status page URL and the key operational commands as soon as you log in.
Step 4: Retrieve the per instance credentials
First boot generates a unique basic authentication username and password for this instance and writes them, with the resolved status page URL, to a root only file. Nothing secret ships inside the image, so this file is the only place the credential exists.
sudo cat /root/cloudprober-credentials.txt
Real output from a running instance, with the secrets redacted:
# Cloudprober on Ubuntu 24.04 LTS (cloudimg AWS Marketplace image) - this VM.
# Generated per-VM on first boot. Keep this file secret (0600 root:root).

# --- Cloudprober console + metrics (HTTPS, per-VM HTTP basic auth via nginx) ---
CLOUDPROBER_USER=cloudimg
CLOUDPROBER_PASSWORD=<CLOUDPROBER_PASSWORD>
CLOUDPROBER_URL=https://<public-ip>/
Step 5: Confirm the services are running
Cloudprober and nginx start automatically after the first boot service has generated the per instance credential and certificate. Confirm both are active:
systemctl is-active cloudprober nginx
Both report active.
Step 6: Confirm the monitoring surface is bound to loopback only
This is the security property that matters most on this image. Cloudprober's own HTTP server has no authentication, so it must never be reachable from the network directly. Confirm it is bound to 127.0.0.1 and that only nginx is listening on the public interface:
ss -ltn | grep -E '9313|:443'
Real output from a running instance:
LISTEN 0      511          0.0.0.0:443       0.0.0.0:*
LISTEN 0      4096       127.0.0.1:9313      0.0.0.0:*
LISTEN 0      511             [::]:443          [::]:*
Port 9313 is bound to 127.0.0.1 only. Port 443 is nginx.
Step 7: Confirm the monitoring surface refuses unauthenticated requests
An unauthenticated request to the status page or the metrics endpoint must be rejected. The following check succeeds when the request is correctly refused:
if curl -sk --fail -o /dev/null -m 10 https://127.0.0.1/metrics; then
  echo "UNEXPECTED: metrics were served without a credential"
  exit 1
else
  echo "refused (exit $?) - correct, the monitoring surface requires the per instance credential"
fi
The unauthenticated health endpoint, which exists for load balancers, is served:
curl -sk -o /dev/null -w 'GET /healthz -> HTTP %{http_code}\n' https://127.0.0.1/healthz
Now authenticate with the per instance credential and confirm the status page answers. This reads the credential straight from the root only file, so the password is never typed or echoed:
U=$(sudo grep -E '^CLOUDPROBER_USER=' /root/cloudprober-credentials.txt | cut -d= -f2-)
P=$(sudo grep -E '^CLOUDPROBER_PASSWORD=' /root/cloudprober-credentials.txt | cut -d= -f2-)
curl -sk -u "$U:$P" -o /dev/null -w 'authenticated GET /status -> HTTP %{http_code}\n' https://127.0.0.1/status
Step 8: Open the status page in a browser
Browse to https://<public-ip>/ and sign in with the username and password from Step 4. The certificate is self signed and generated per instance, so your browser will warn once; accept it, or replace the certificate with your own as described later.
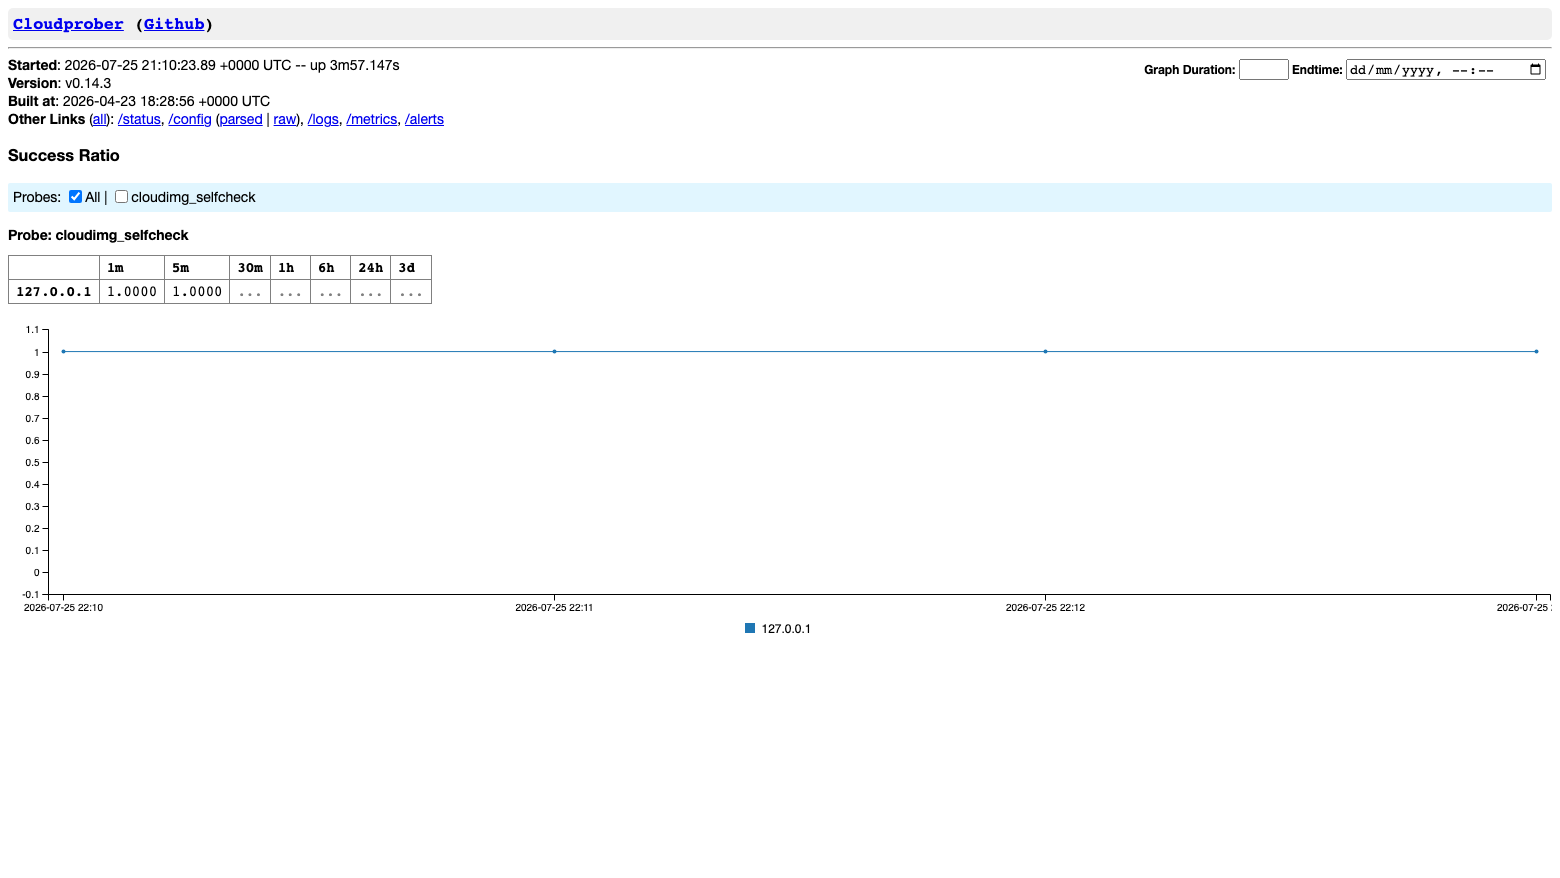
The status page shows every configured probe, its success ratio over several time windows, and a chart of that ratio over time. Out of the box it shows the bundled cloudimg_selfcheck demo probe, which monitors this instance's own status endpoint so the full probe to surfacer to metrics pipeline is exercised with no external dependency.
Step 9: Review the running configuration
The /config view renders the configuration Cloudprober is actually running, including every probe with its type, interval, timeout and targets, and the configured surfacers.
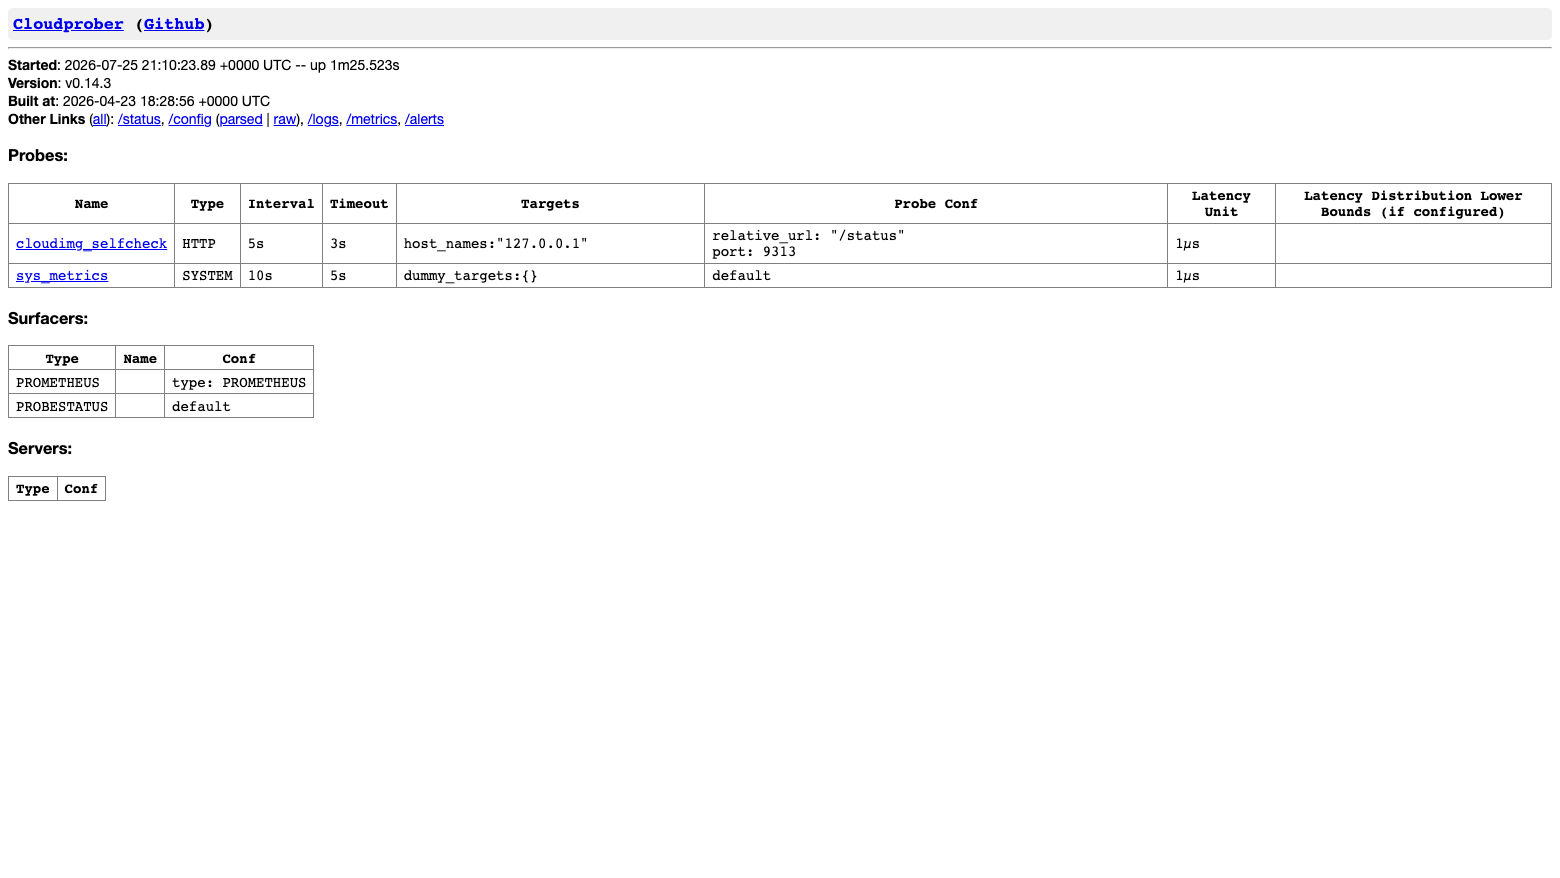
You can also read the same configuration on the instance:
grep -vE '^\s*#' /etc/cloudprober.cfg | grep -vE '^\s*$'
Real output from a running instance:
host: "127.0.0.1"
port: 9313
surfacer {
  type: PROMETHEUS
}
probe {
  name: "cloudimg_selfcheck"
  type: HTTP
  targets {
    host_names: "127.0.0.1"
  }
  http_probe {
    port: 9313
    relative_url: "/status"
  }
  interval_msec: 5000
  timeout_msec: 3000
}
Step 10: Scrape the Prometheus metrics
Every probe exports the standard total, success, latency, timeouts and failure series in Prometheus format. Confirm the demo probe is reporting success:
U=$(sudo grep -E '^CLOUDPROBER_USER=' /root/cloudprober-credentials.txt | cut -d= -f2-)
P=$(sudo grep -E '^CLOUDPROBER_PASSWORD=' /root/cloudprober-credentials.txt | cut -d= -f2-)
curl -sk -u "$U:$P" https://127.0.0.1/metrics | grep -E 'probe="cloudimg_selfcheck"'
Real output from a running instance:
total{ptype="http",probe="cloudimg_selfcheck",dst="127.0.0.1"} 18
success{ptype="http",probe="cloudimg_selfcheck",dst="127.0.0.1"} 18
latency{ptype="http",probe="cloudimg_selfcheck",dst="127.0.0.1"} 13142.685
timeouts{ptype="http",probe="cloudimg_selfcheck",dst="127.0.0.1"} 0
resp_code{ptype="http",probe="cloudimg_selfcheck",dst="127.0.0.1",code="200"} 18
failure{ptype="http",probe="cloudimg_selfcheck",dst="127.0.0.1"} 0
success equals total and failure is zero, so every probe attempt has succeeded.
To scrape this instance from an external Prometheus, point a job at port 443 with scheme: https, tls_config.insecure_skip_verify: true (or trust your own certificate) and a basic_auth block carrying this instance's username and password.

Step 11: Add probes for your own targets
The whole product is one configuration file. Add a probe block per target, then reload. Cloudprober supports HTTP, PING, DNS, TCP, GRPC and EXTERNAL probe types.
For example, to monitor two public web endpoints every thirty seconds, add:
probe {
  name: "my_website"
  type: HTTP
  targets {
    host_names: "www.example.com,api.example.com"
  }
  http_probe {
    protocol: HTTPS
    relative_url: "/"
  }
  interval_msec: 30000
  timeout_msec: 5000
}
Edit the file and apply the change. Note that cloudprober.service defines no reload action, so systemctl reload is not applicable here; use restart, which is effectively instant for a single static binary.
sudo nano /etc/cloudprober.cfg
sudo systemctl restart cloudprober
Confirm the service came back up cleanly after a restart:
sudo systemctl restart cloudprober && sleep 3 && systemctl is-active cloudprober
Each probe you add appears on the status page and exports its own success, total and latency series to /metrics under its probe label, ready to alert on.
Step 12: Review the probe logs
The /logs view shows Cloudprober's own structured log, filterable by source and level. It is the quickest way to confirm a newly added probe is resolving its targets.
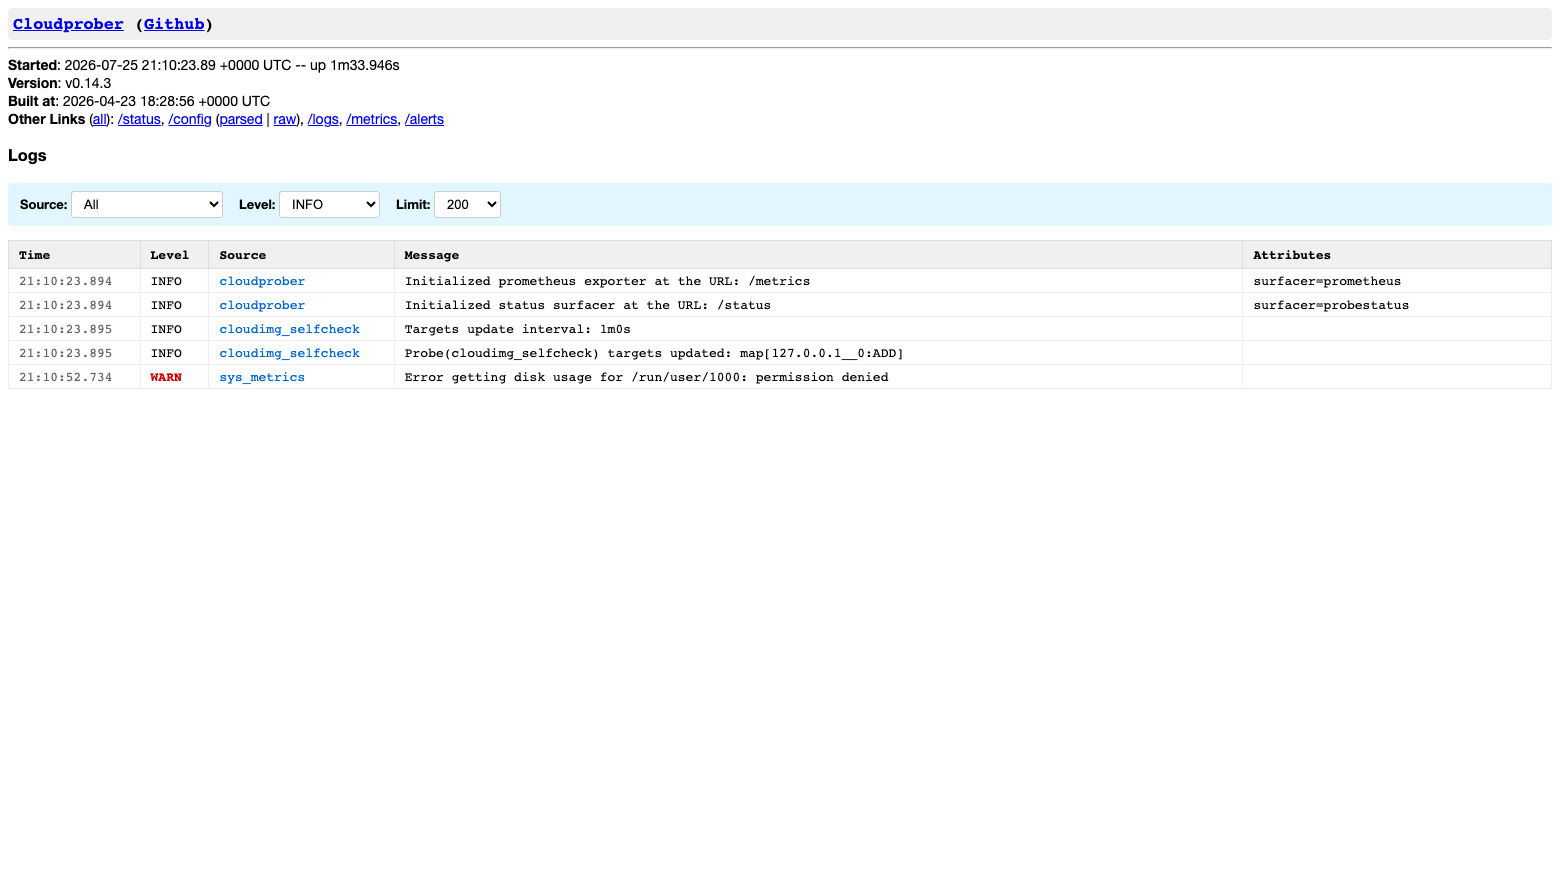
You can read the same log from systemd:
sudo journalctl -u cloudprober --no-pager | tail -5
Replacing the TLS certificate
First boot generates a self signed certificate whose common name and subject alternative names cover this instance's public address, hostname and 127.0.0.1. For production use, replace it with a certificate issued for a DNS name you control. Install your certificate and key over the two files below, keeping the same paths and permissions, then reload nginx.
sudo ls -l /etc/nginx/tls/
Place your PEM encoded certificate at /etc/nginx/tls/cloudprober.crt and your private key at /etc/nginx/tls/cloudprober.key (mode 0600, owned by root), then validate and reload:
sudo nginx -t
If the configuration test passes, apply it with sudo systemctl reload nginx.
Changing the basic authentication password
The per instance credential lives in an nginx htpasswd file. To rotate it, generate a new entry and reload nginx. Replace <password> with your own value.
sudo sh -c 'printf "cloudimg:%s\n" "$(openssl passwd -apr1 "<password>")" > /etc/nginx/cloudprober.htpasswd'
sudo chown root:www-data /etc/nginx/cloudprober.htpasswd
sudo chmod 0640 /etc/nginx/cloudprober.htpasswd
sudo systemctl reload nginx
Remember to update /root/cloudprober-credentials.txt so the note stays accurate.
Maintenance
Check the installed version:
/opt/cloudprober/cloudprober --version
Real output from a running instance:
v0.14.3
Restart or reload the services after a configuration change:
systemctl status cloudprober --no-pager | head -4
Operating system security updates are applied automatically by unattended upgrades. To upgrade Cloudprober itself, download the newer release from the upstream project, verify its checksum, replace /opt/cloudprober/cloudprober and restart the service.
Support
cloudimg provides 24/7 technical support for this image via email and live chat.
- Email: support@cloudimg.co.uk
- Live chat: available 24/7 on cloudimg.co.uk
We help with deployment, upgrades, probe configuration, TLS termination, scraping the metrics into your existing monitoring stack, and troubleshooting.