
Gatus Health and Uptime Monitoring Dashboard on AWS User Guide
Overview
Gatus is an automated health and uptime monitoring dashboard and status page. You describe the services you want to watch as a short list of endpoints in a single YAML file, each with its own check interval and success conditions, and Gatus continuously probes them and renders a clear, real time status page that shows what is up, what is down and how each service has behaved over time. Conditions are expressive, covering HTTP status, response time, response body, DNS answers and TLS certificate expiry across HTTP, TCP, ICMP, DNS and other protocols, and the same results are available as a JSON API. It is a single Go binary with an embedded SQLite backend, so it stays lightweight and starts instantly.
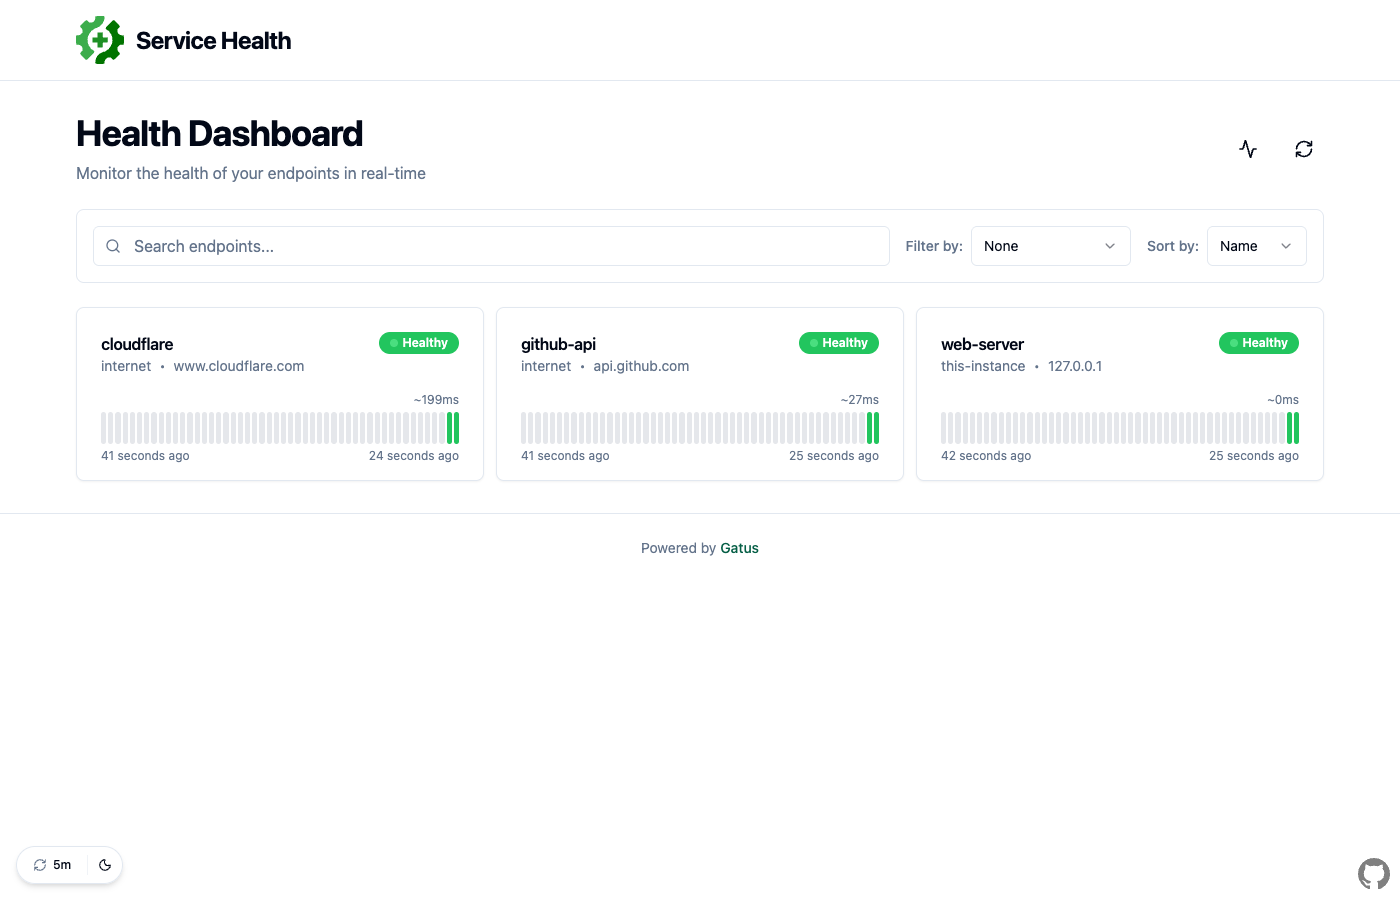
The cloudimg image installs Gatus and puts it behind an nginx reverse proxy that binds the server to loopback. The appliance is secure by default: the status dashboard is read only by design, so there is no web admin surface, no login to manage and no credential of any kind baked into the image. The Prometheus metrics endpoint is disabled so nothing beyond the intended dashboard and JSON API is exposed. A sensible default configuration monitors the instance's own web server and a couple of well known public endpoints, so the dashboard is populated on first boot and you can immediately replace the examples with your own services.
What is included:
- Gatus single Go binary (
/usr/local/bin/gatus) - Embedded SQLite history database at
/var/lib/gatus/data.db(no separate database to maintain) gatus.servicerunning as thegatususer, bound to loopback127.0.0.1:8080nginx.servicereverse proxy on TCP 80, TLS readygatus-firstboot.serviceresolving this instance's URL into the MOTD and a root only info note on first boot- A read only status dashboard at
/plus a JSON status API at/api/v1/endpoints/statuses - Prometheus
/metricsdisabled by default, so only the dashboard and API are exposed - Ubuntu 24.04 LTS base, latest patches, unattended security upgrades enabled
- 24/7 cloudimg support
Prerequisites
Before you deploy this image you need:
- An Amazon Web Services account where you can launch EC2 instances
- IAM permissions to launch instances, create security groups, and subscribe to AWS Marketplace products
- An EC2 key pair in the target Region for SSH access to the instance
- A VPC and subnet in the target Region, with a security group allowing inbound port 22 from your management network and inbound ports 80 and 443 from the networks your users will reach the dashboard on
- The AWS CLI (version 2) installed locally if you plan to deploy from the command line
Connecting to your instance
Connect over SSH on port 22 as the default login user for the operating system variant you launched. This listing currently ships the following variant:
| OS variant | SSH login user |
|---|---|
| Ubuntu 24.04 LTS | ubuntu |
The dashboard is served on port 80 through nginx (Gatus itself listens only on 127.0.0.1:8080).
Step 1: Launch the Instance from the AWS Marketplace
Sign in to the AWS Management Console, open the EC2 service, and select Launch instance. Under Application and OS Images choose AWS Marketplace AMIs and search for Gatus. Select the cloudimg listing and choose Select, then Continue on the subscription summary.
Pick an instance type of m5.large or larger (Gatus is very light, but m5.large is the tested recommendation). Choose your EC2 key pair under Key pair (login). Under Network settings select your VPC and subnet, and either create or select a security group that allows inbound port 22 from your management network and inbound ports 80 and 443 from the networks your users use. Leave the root volume at the default size or larger.
Select Launch instance. First boot initialisation takes under a minute after the instance state becomes Running and the status checks pass.
Step 2: Launch the Instance from the AWS CLI
The following block launches an instance from the cloudimg Gatus Marketplace AMI into an existing subnet and security group. Replace <ami-id> with the AMI ID shown on the Marketplace listing, <key-name> with your EC2 key pair name, <subnet-id> with your subnet ID, and <security-group-id> with a security group that opens ports 22, 80, and 443 as described above.
aws ec2 run-instances \
  --image-id <ami-id> \
  --instance-type m5.large \
  --key-name <key-name> \
  --subnet-id <subnet-id> \
  --security-group-ids <security-group-id> \
  --metadata-options "HttpTokens=required,HttpEndpoint=enabled" \
  --tag-specifications 'ResourceType=instance,Tags=[{Key=Name,Value=gatus}]'
The image resolves this instance's public address on first boot using the EC2 Instance Metadata Service (IMDSv2), so it works with HttpTokens=required enabled.
Step 3: Connect via SSH
Connect as the ubuntu user (see the Connecting to your instance table above for other variants).
ssh ubuntu@<public-ip>
The message of the day prints the dashboard URL, the status API URL and the key operational commands as soon as you log in.
Step 4: View the per-instance info note
Gatus has no login and no credential to retrieve, but the first boot service writes a root only note with the resolved dashboard URL for convenience:
sudo cat /root/gatus-info.txt
Step 5: Confirm the services are running
Gatus and nginx start automatically. Confirm both are active:
systemctl is-active gatus nginx
Step 6: Open the status dashboard
Browse to http://<public-ip>/ to see the live status page. It refreshes automatically and shows each configured endpoint with its current health, recent checks and average response time. Because the dashboard is read only and has no login, it is safe to publish as a status page, but you should still restrict who can reach it if the endpoint names or URLs are sensitive.
Verify the dashboard is answering (from the instance itself, through nginx):
for i in $(seq 1 30); do
  code=$(curl -s -o /dev/null -w '%{http_code}' -m 5 http://127.0.0.1/)
  [ "$code" = "200" ] && break
  sleep 2
done
echo "dashboard HTTP $code"
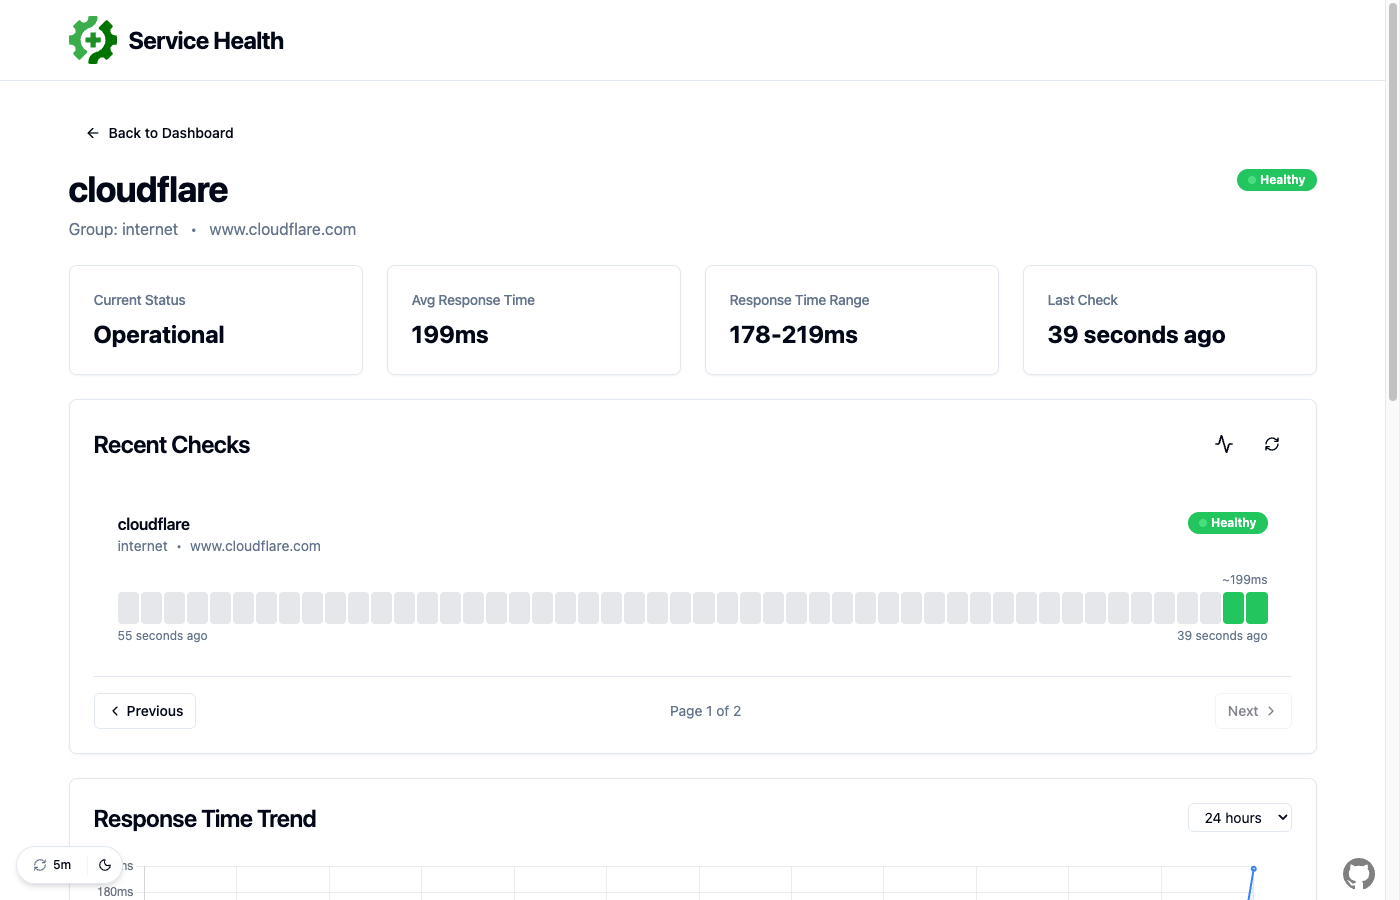
Each endpoint links to a detail view with its current status, average response time, response time range, recent check history and a response time trend chart.
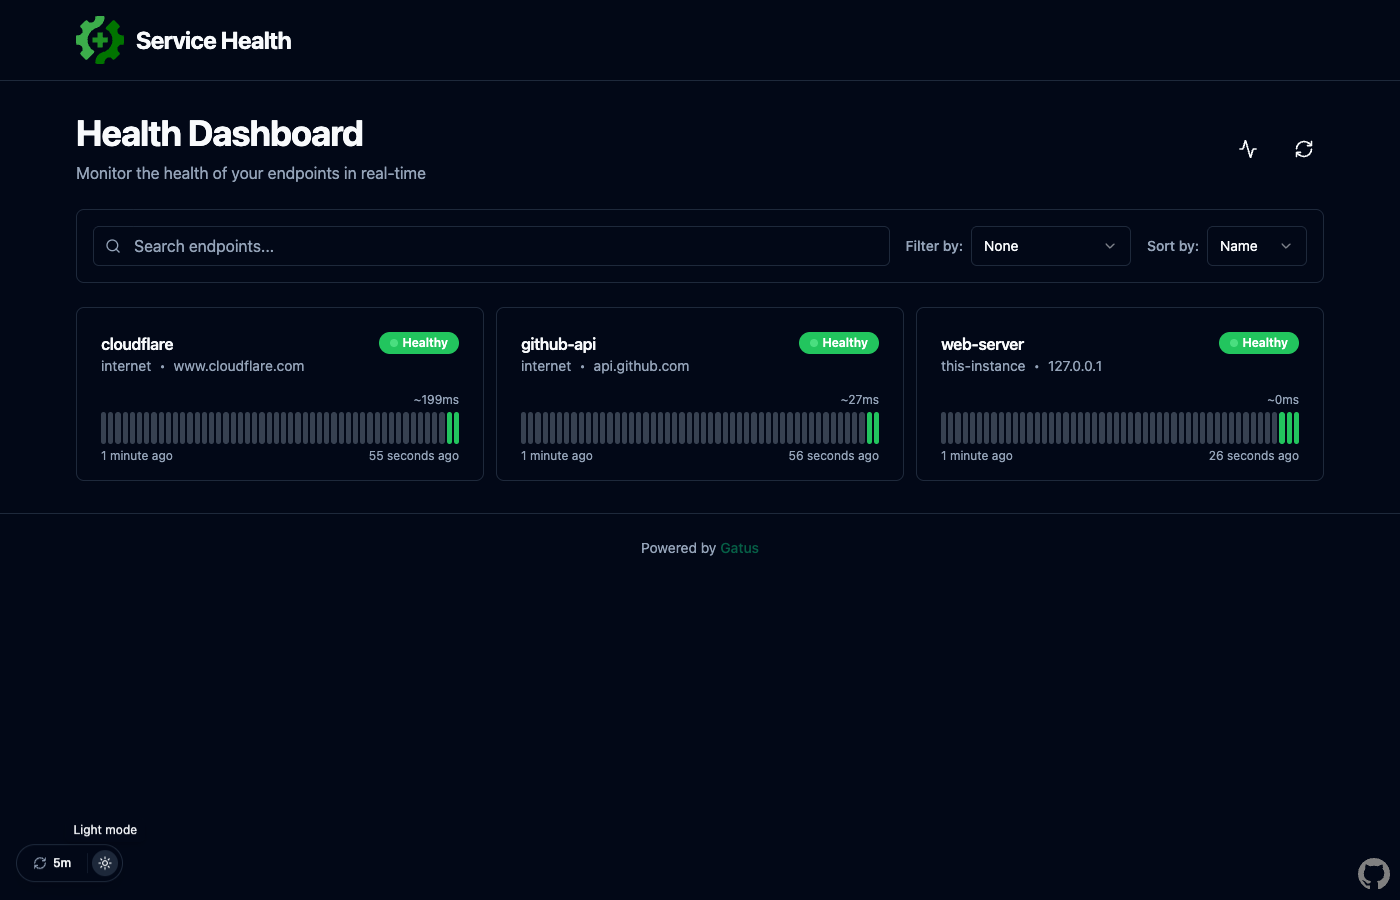
The dashboard also has a built in dark mode.
Step 7: Query the JSON status API
The same results are available as JSON, which is useful for scripting and for wiring Gatus into your own tooling:
curl -s http://127.0.0.1/api/v1/endpoints/statuses | jq '[.[] | {name, group, healthy: ([.results[]?|select(.success==true)]|length>0)}]'
Step 8: Edit the monitored endpoints
The whole configuration lives in one declarative YAML file. Add or edit the services you want to watch under endpoints:, then restart Gatus to apply. Each endpoint has a url, an interval, and one or more conditions such as [STATUS] == 200, [RESPONSE_TIME] < 300, or [CERTIFICATE_EXPIRATION] > 240h.
sudo nano /etc/gatus/config.yaml
sudo systemctl restart gatus
The default configuration monitors this instance's own web server (an always available local nginx health target) plus two well known public endpoints including a TLS certificate expiry check, so the dashboard is populated the moment the instance boots. Replace those examples with your own services.
Step 9: Optional viewer password (basic authentication)
The dashboard ships open and read only by design. If you would prefer to require a viewer password, Gatus supports HTTP basic authentication. Install apache2-utils for the htpasswd tool, generate a bcrypt hash on this instance (never bake one into an image) and add a security.basic block to the configuration. Do not reuse a hash across instances.
# Install the htpasswd tool, then generate a bcrypt hash for your chosen
# password on THIS instance (replace <viewer-password> with your own):
sudo apt-get install -y apache2-utils
htpasswd -bnBC 10 "" "<viewer-password>" | tr -d ':\n'
Add the resulting hash under a security block in /etc/gatus/config.yaml (see the Gatus documentation for the exact security.basic schema), then restart Gatus with sudo systemctl restart gatus.
Step 10: Enable HTTPS
For production, terminate TLS at nginx. Point a DNS record at the instance, open port 443, and obtain a certificate with certbot. Replace <your-domain> with your hostname.
sudo apt-get update && sudo apt-get install -y certbot python3-certbot-nginx
sudo certbot --nginx -d <your-domain>
certbot installs and renews the certificate and updates the nginx server block automatically.
Maintenance
- Service management:
systemctl status gatus nginx,sudo systemctl restart gatusafter a config change. - Logs:
journalctl -u gatus -n 100 --no-pagerfor the monitor,journalctl -u nginxfor the proxy. - History database: the SQLite history lives at
/var/lib/gatus/data.db. It is captured empty in the image and grows on your instance as checks run; it needs no separate maintenance. - Patching: the base ships with unattended security upgrades enabled. Reboot after kernel updates during a maintenance window.
Support
cloudimg provides 24/7 technical support for this image via email at support@cloudimg.co.uk and live chat. We help with deployment, upgrades, authoring and tuning the YAML endpoint configuration, enabling an optional viewer password, TLS termination, and troubleshooting.