
GoAccess on AWS User Guide
Overview
This image runs GoAccess, the fast real-time web-log analyzer. GoAccess parses web server access logs and renders them as an interactive HTML dashboard you open in a browser: unique visitors, requested files, static resources, not-found URLs, visitor hosts, operating systems, browsers, HTTP status codes, referrers and bandwidth, all updating live as new requests arrive over a WebSocket.
GoAccess is built from the official 1.10.2 release and runs as the dedicated goaccess system user under systemd. It writes a real-time HTML report and drives a WebSocket server on the loopback interface at 127.0.0.1:7890, fronted by nginx as a reverse proxy on port 80 (and 443 once you add TLS). nginx serves the dashboard behind HTTP Basic Auth and proxies the WebSocket, with an unauthenticated health endpoint at /healthz for load balancers and uptime checks. The generated report, the persisted parse database and the Basic Auth password file all live on a dedicated EBS data volume mounted at /var/lib/goaccess, independently resizable and separate from the operating system disk.
Out of the box the dashboard analyzes the instance's own nginx access log, so it is populated the moment you open it. On the first boot of every deployed instance, a one-shot service generates a dashboard password unique to that instance, applies it as an nginx HTTP Basic Auth credential for the user admin, records it in /root/goaccess-credentials.txt with mode 0600, and templates the live-update WebSocket URL to the instance's own public address. No shared or default credentials ship in the image.
Prerequisites
Before you deploy this image you need:
- An Amazon Web Services account where you can launch EC2 instances
- IAM permissions to launch instances, create security groups, and subscribe to AWS Marketplace products
- An EC2 key pair in the target Region for SSH access to the instance
- A VPC and subnet in the target Region, with a security group allowing inbound port 22 from your management network and inbound ports 80 and 443 from the networks your operators will reach the GoAccess dashboard on
- The AWS CLI (version 2) installed locally if you plan to deploy from the command line
Step 1: Launch the Instance from the AWS Marketplace
Sign in to the AWS Management Console, open the EC2 service, and select Launch instance. Under Application and OS Images choose AWS Marketplace AMIs and search for GoAccess. Select the cloudimg listing and choose Select, then Continue on the subscription summary.
Pick an instance type of m5.large or larger. Choose your EC2 key pair under Key pair (login). Under Network settings select your VPC and subnet, and either create or select a security group that allows inbound port 22 from your management network and inbound ports 80 and 443 from the networks your users will reach the dashboard on. Leave the root volume at the default size or larger; the image adds a separate data volume for the report and parse database automatically.
Select Launch instance. First boot initialisation takes under a minute after the instance state becomes Running and the status checks pass.
Step 2: Launch the Instance from the AWS CLI
The following block launches an instance from the cloudimg GoAccess Marketplace AMI into an existing subnet and security group. Replace <ami-id> with the AMI ID shown on the Marketplace listing, <key-name> with your EC2 key pair name, <subnet-id> with your subnet ID, and <security-group-id> with a security group that opens ports 22, 80 and 443 as described above.
aws ec2 run-instances \
  --image-id <ami-id> \
  --instance-type m5.large \
  --key-name <key-name> \
  --subnet-id <subnet-id> \
  --security-group-ids <security-group-id> \
  --block-device-mappings '[{"DeviceName":"/dev/sda1","Ebs":{"VolumeSize":30,"VolumeType":"gp3"}}]' \
  --tag-specifications 'ResourceType=instance,Tags=[{Key=Name,Value=goaccess-01}]'
The command prints a JSON document on success. Note the instance ID, then retrieve its public address once it is running with aws ec2 describe-instances --instance-ids <instance-id> --query "Reservations[].Instances[].PublicIpAddress" --output text.
Step 3: Connect and Retrieve the Dashboard Password
Connect over SSH with the key pair you selected and the public IP address from step 2. The SSH login user depends on the operating system of the AMI variant you launched:
| AMI variant | SSH login user |
|---|---|
| GoAccess 1.10 on Ubuntu 24.04 | ubuntu |
The first boot service runs before the SSH daemon becomes ready, so the credentials file is always in place when you log in for the first time.
ssh <login-user>@<public-ip>
sudo cat /root/goaccess-credentials.txt
You will see a plain text file containing the dashboard URL, the username admin, and the per-instance dashboard password. From the same SSH session you can confirm the deployment is healthy; the health endpoint is open and served by nginx:
curl -fsS http://127.0.0.1/healthz
ok
An ok response confirms nginx is fronting the application. You can also confirm the services that make up the stack are running and enabled, and check the GoAccess version:
systemctl is-active goaccess nginx goaccess-firstboot
goaccess --version
active
active
active
GoAccess - 1.10.2.
For more details visit: https://goaccess.io/
Copyright (C) 2009-2024 by Gerardo Orellana
GoAccess listens on the loopback interface and nginx publishes the dashboard on port 80. You can confirm the listening sockets:
sudo ss -tlnp | grep -E ':80 |:7890 '
LISTEN 0 4096 127.0.0.1:7890 0.0.0.0:* users:(("goaccess",...))
LISTEN 0 511  0.0.0.0:80     0.0.0.0:* users:(("nginx",...))
Step 4: Sign In to the Dashboard
Open http://<public-ip>/ in your browser. nginx challenges you with HTTP Basic Auth: enter the username admin and the per-instance password from the credentials file. GoAccess then serves the real-time dashboard. The Overall Analyzed Requests panel at the top summarises total and valid requests, unique visitors, requested files, referrers, not-found URLs, log size and transferred bandwidth, and the Last Updated badge shows the live WebSocket connection pushing updates as new requests arrive.
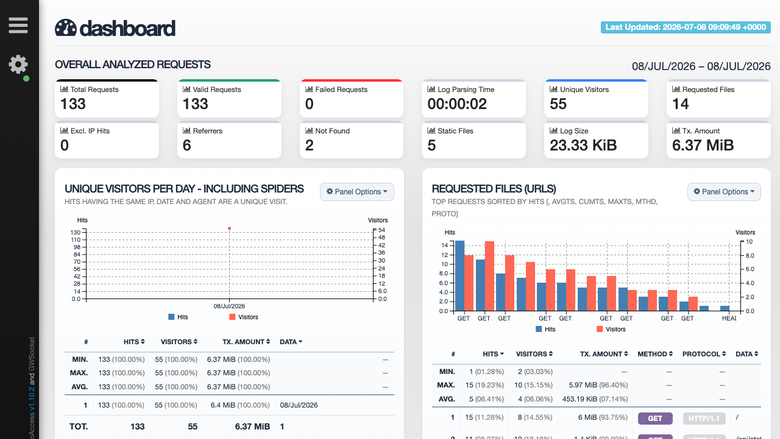
Because the image ships analyzing the instance's own nginx access log, the dashboard is already populated on first view. As traffic reaches the instance the panels update in real time without a page refresh.
Step 5: Read the Analytics Panels
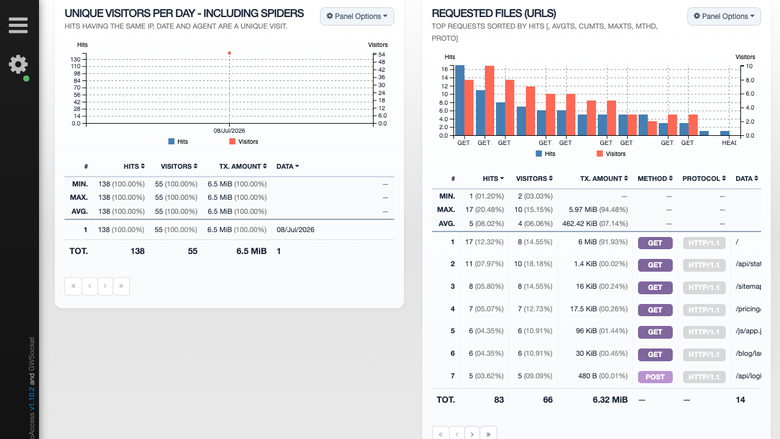
Scroll down through the stacked panels. The Unique Visitors Per Day chart plots hits and visitors over time, and the Requested Files (URLs) panel ranks the most-requested paths by hits, visitors and bandwidth, with the request method and protocol for each.
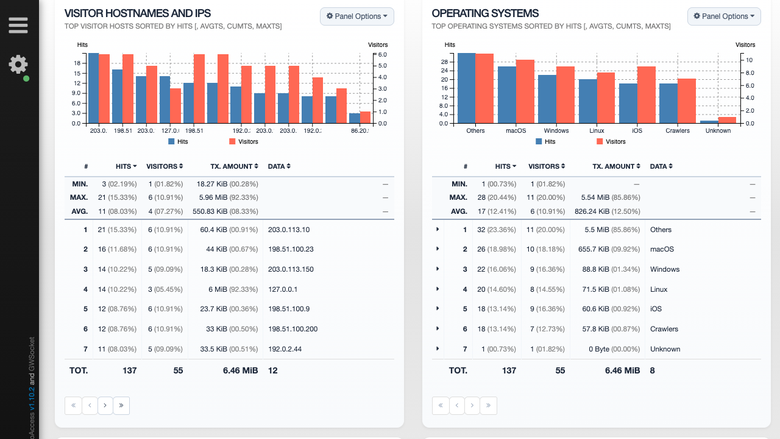
The Visitor Hostnames and IPs panel shows which clients are generating traffic, and the Operating Systems and Browsers panels break visitors down by platform and user agent. Every panel has a sortable table and a chart, and the Panel Options menu lets you change the metric plotted or expand the rows shown.
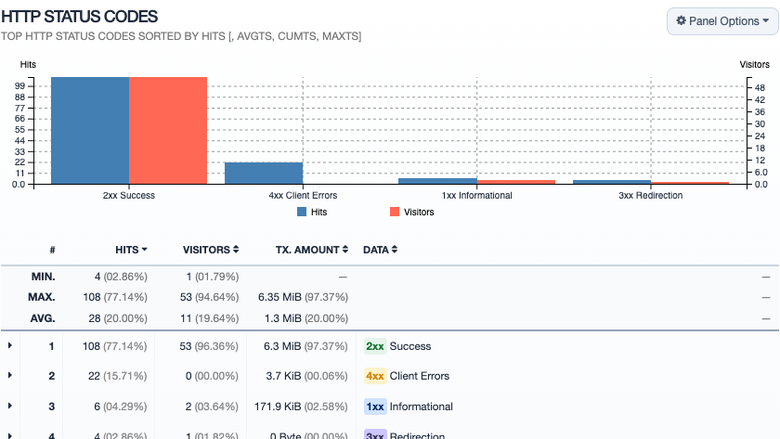
The HTTP Status Codes panel groups responses into 2xx success, 3xx redirection, 4xx client errors and other classes, so you can spot a rise in errors at a glance. Further panels cover static requests, not-found URLs, referrers, referring sites and time distribution.
Step 6: Point GoAccess at Your Own Logs
Out of the box GoAccess analyzes this instance's own nginx access log at /var/log/nginx/access.log. To analyze your own web server, CDN or reverse-proxy logs, edit the service environment file and set GOACCESS_LOG to your log path, then restart the service. The default configuration expects the combined log format, which nginx and Apache both use by default.
cat /etc/goaccess/goaccess.env
GOACCESS_LOG=/var/log/nginx/access.log
WS_URL=ws://<public-ip>:80/ws
Edit the file with sudo, change the GOACCESS_LOG line to your log file, and restart GoAccess. It re-parses the log, rebuilds the report and resumes streaming live updates:
sudo systemctl restart goaccess
GoAccess supports many log formats beyond combined, including the common log format, W3C, Amazon CloudFront, Amazon S3, Application and Classic Load Balancer, Caddy and Traefik. To use one of those, add the matching --log-format value to the ExecStart line, or copy the logs from your other hosts onto this instance and point GOACCESS_LOG at them.
Step 7: Add or Change Dashboard Users
The dashboard is protected by an nginx HTTP Basic Auth file at /var/lib/goaccess/.htpasswd. To change the admin password or add more users, use htpasswd and reload nginx. No GoAccess restart is needed because nginx owns the credential check.
sudo htpasswd -bB /var/lib/goaccess/.htpasswd analyst <new-password>
sudo systemctl reload nginx
The -B flag stores a bcrypt hash, matching the format the first boot service uses; -b takes the password on the command line, or omit it to be prompted interactively. Replace <new-password> with the password you want to set.
Step 8: Configure HTTPS and the Encrypted WebSocket
For production you should serve the dashboard and its live-update WebSocket over HTTPS. Point a DNS name at the instance, open port 443 in the security group, and install a certificate with a tool such as Certbot, which can update the nginx site automatically. Once nginx serves TLS on 443, update the WebSocket URL so the dashboard connects over the encrypted wss:// scheme: set WS_URL in /etc/goaccess/goaccess.env to wss://your-goaccess-host:443/ws and restart GoAccess. GoAccess bakes the WebSocket URL into the report, so live updates only work when the URL matches the address and scheme your browser uses to reach nginx.
sudo systemctl restart goaccess
Health Checks and Monitoring
nginx serves an unauthenticated health endpoint at /healthz that returns 200 ok, suitable for an Elastic Load Balancer target group or an external uptime monitor. The dashboard and every other path require the Basic Auth credential, while the health endpoint stays open.
curl -fsS http://127.0.0.1/healthz
ok
You can inspect the service logs at any time with journalctl:
sudo journalctl -u goaccess -n 50 --no-pager
Backup and Maintenance
GoAccess keeps its persisted parse database, the generated report and the Basic Auth password file on the dedicated data volume at /var/lib/goaccess. Stopping the service flushes the in-memory parse data to the on-disk database, which is reloaded when the service starts again, so history survives restarts. Snapshot the EBS data volume on your normal schedule to back up the parse database and the dashboard credentials.
sudo ls /var/lib/goaccess
Keep the instance patched with your normal operating-system update process. The GoAccess binary is installed at /usr/local/bin/goaccess; to move to a newer release, replace that binary and restart the service.
Troubleshooting
If the browser returns 401 Unauthorized, confirm you are using the username admin and the exact password from /root/goaccess-credentials.txt. If the dashboard loads but the Last Updated badge never advances, the live-update WebSocket is not connecting: check that WS_URL in /etc/goaccess/goaccess.env matches the address and scheme your browser uses to reach the instance, and that ports 80 (or 443 for wss://) are open in the security group. If the dashboard is empty, confirm the log named in GOACCESS_LOG exists and is in the expected format, then restart GoAccess.
systemctl status goaccess --no-pager
Support
This image is published and supported by cloudimg. If you need help deploying, repointing GoAccess at your own logs, configuring HTTPS and the encrypted WebSocket, enabling GeoIP location, or scaling analytics across multiple hosts, contact cloudimg support by email and chat, available 24/7.