Grafana 12 OSS on Ubuntu 24.04 on Azure User Guide
Overview
This guide covers the deployment and configuration of Grafana 12 OSS on Ubuntu 24.04 on Azure using cloudimg Azure Marketplace images. Grafana is the de facto open source observability dashboard, with built-in support for over 100 data sources including Prometheus, Loki, Azure Monitor, CloudWatch, PostgreSQL, MySQL, MariaDB, ClickHouse, Elasticsearch, OpenSearch, InfluxDB, and Tempo.
The image ships Grafana 12.4 from the official packages.grafana.com APT repository (stable channel) pinned via apt-mark hold so future apt-get upgrade runs do not pull Grafana 13. On every fresh customer virtual machine, grafana-firstboot.service rotates the admin password from the build-time temp value to a per-VM strong password using grafana-cli admin reset-admin-password. Credentials are written to /stage/scripts/grafana-credentials.log (mode 0600). No two virtual machines ever share an admin password; no password is baked into the image.
What is included:
-
Grafana 12 OSS server from the official packages.grafana.com APT stable channel (pinned to 12.x, held against upgrade)
-
grafana-server.servicesystemd unit auto-starting on boot -
grafana-firstboot.servicesystemd oneshot that rotates the admin password -
Listener on TCP 3000 (HTTP) bound to 0.0.0.0
-
Bundled SQLite backend at
/var/lib/grafana/grafana.db(suitable for single-instance deployments) -
grafana-cliat/usr/sbin/grafana-clifor plugin management and admin password reset -
Ubuntu 24.04 LTS base with latest security patches applied at build time
-
Azure Linux Agent for seamless cloud integration and SSH key injection
-
24/7 cloudimg support with guaranteed 24 hour response SLA
Prerequisites
-
An active Azure subscription
-
A subscription to the Grafana 12 OSS on Ubuntu 24.04 listing on Azure Marketplace
-
An SSH public key for VM authentication
-
A virtual network and subnet in the target region
Recommended virtual machine size: Standard_B2s (2 vCPU, 4 GB RAM) for small deployments. Scale up to Standard_D2s_v3 for fleets serving more than 50 dashboards or with heavy ad-hoc query load.
Step 1: Deploy from the Azure Portal
Navigate to Marketplace in the Azure Portal, search for Grafana 12, select the cloudimg publisher entry, and click Create.
On the Networking tab attach a network security group that allows inbound TCP 22 from your management IP range and TCP 3000 from your trusted client networks. Do not expose port 3000 to the public internet without TLS — Grafana ships listening on plain HTTP by design (terminate TLS at a reverse proxy). The cloudimg nginx-ssl-certbot-ubuntu-24-04 image makes a good companion reverse proxy.
Click Review + create, wait for validation, then Create. Deployment takes around two minutes.
Step 2: Deploy from the Azure CLI
RG="grafana-prod"
LOCATION="eastus"
VM_NAME="grafana-01"
ADMIN_USER="azureuser"
GALLERY_IMAGE_ID="/subscriptions/<sub-id>/resourceGroups/azure-cloudimg/providers/Microsoft.Compute/galleries/cloudimgGallery/images/grafana-12-ubuntu-24-04/versions/<version>"
SSH_KEY="$(cat ~/.ssh/id_rsa.pub)"

az group create --name "$RG" --location "$LOCATION"

az network vnet create \
  --resource-group "$RG" \
  --name grafana-vnet --address-prefix 10.93.0.0/16 \
  --subnet-name grafana-subnet --subnet-prefix 10.93.1.0/24

az network nsg create --resource-group "$RG" --name grafana-nsg

az network nsg rule create \
  --resource-group "$RG" --nsg-name grafana-nsg \
  --name allow-ssh --priority 100 \
  --source-address-prefixes "<your-mgmt-cidr>" \
  --destination-port-ranges 22 --access Allow --protocol Tcp

az network nsg rule create \
  --resource-group "$RG" --nsg-name grafana-nsg \
  --name allow-grafana --priority 110 \
  --source-address-prefixes "<your-mgmt-cidr>" \
  --destination-port-ranges 3000 --access Allow --protocol Tcp

az vm create \
  --resource-group "$RG" --name "$VM_NAME" \
  --image "$GALLERY_IMAGE_ID" \
  --size Standard_B2s --storage-sku StandardSSD_LRS \
  --admin-username "$ADMIN_USER" --ssh-key-values "$SSH_KEY" \
  --vnet-name grafana-vnet --subnet grafana-subnet --nsg grafana-nsg \
  --public-ip-sku Standard
Step 3: Connect via SSH
ssh azureuser@<vm-ip>
grafana-server.service will already be running and grafana-firstboot.service will already have rotated the admin password to a per-VM value.
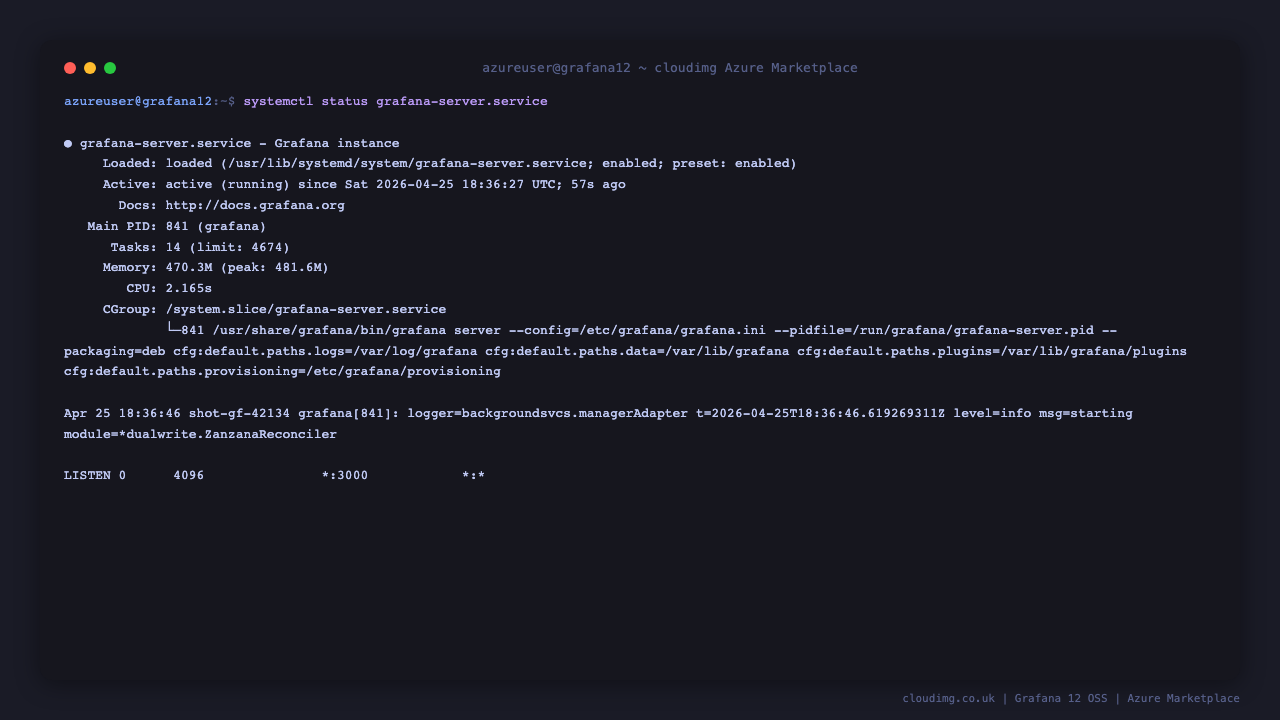
Step 4: Verify the Grafana Service
sudo systemctl status grafana-server.service --no-pager
Expected: active (running). Confirm the firstboot sentinel:
sudo test -f /var/lib/cloudimg/grafana-firstboot.done && echo FIRSTBOOT_DONE
Confirm the listener on port 3000:
sudo ss -tln | grep 3000
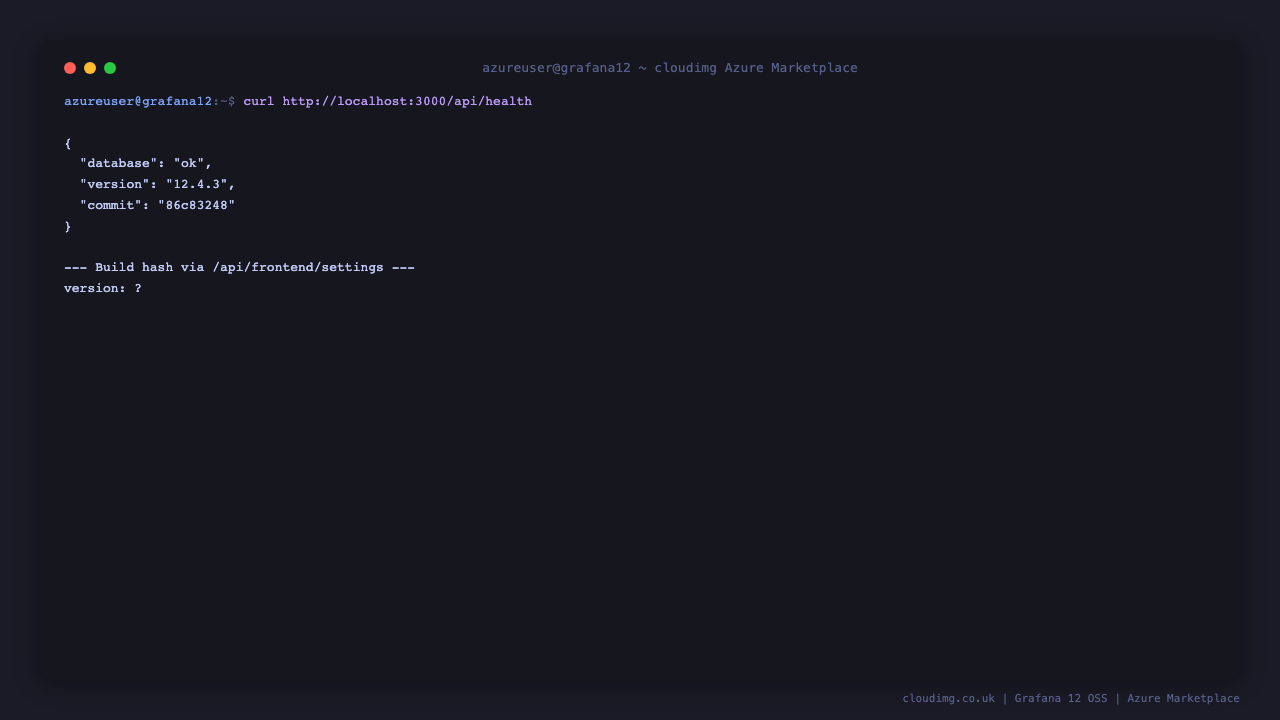
Confirm the API responds healthy:
curl -s http://localhost:3000/api/health
You should see {"database": "ok", "version": "12.4.x", "commit": "..."}.
Step 5: Retrieve the Admin Password
sudo cat /stage/scripts/grafana-credentials.log
You will see:
ADMIN_USER=admin
ADMIN_PASSWORD=<ADMIN_PASSWORD>
PORT=3000
URL=http://<vm-ip>:3000
Store the password in your secret store. The file is mode 0600 (root only).
Step 6: First Login
Open http://<vm-ip>:3000 in your browser. You will see the Grafana 12 sign in page:
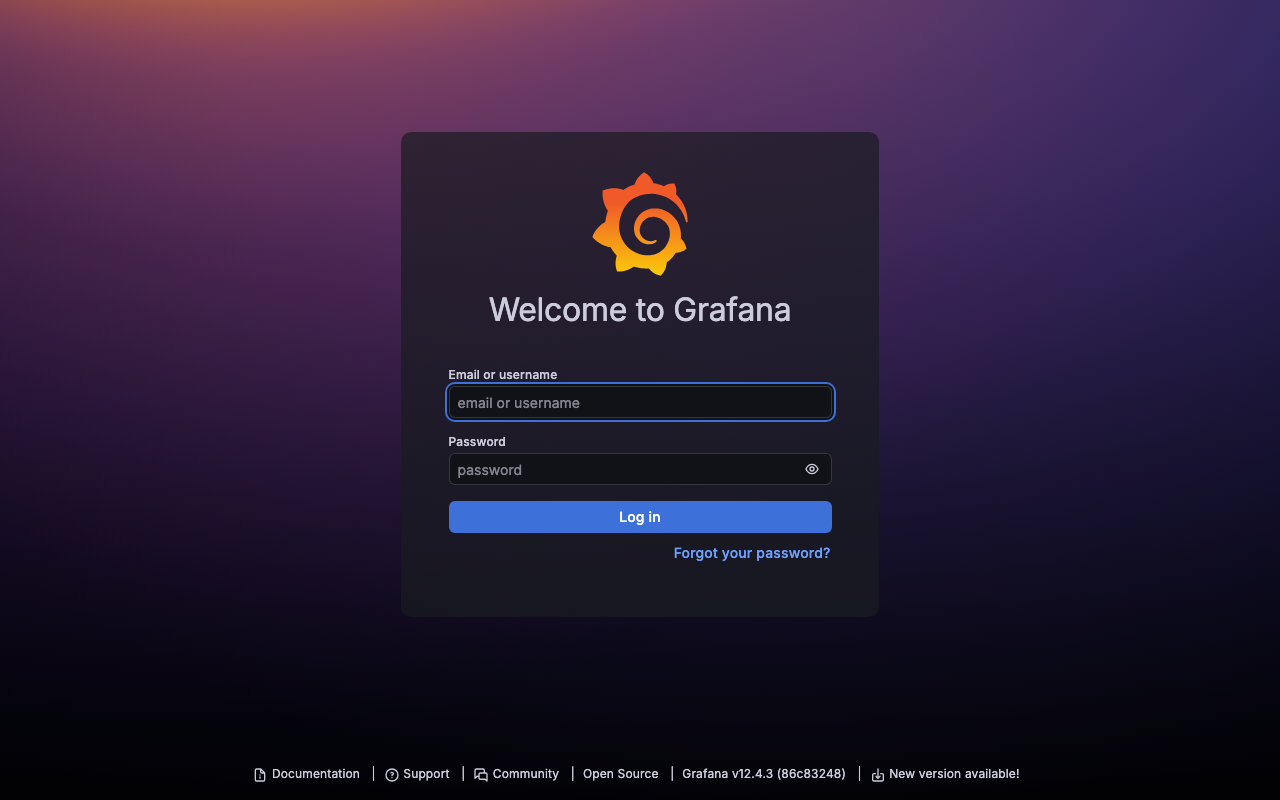
Sign in with admin and the password from Step 5. After login Grafana lands on the welcome dashboard with quick links to add a data source and create your first dashboard:
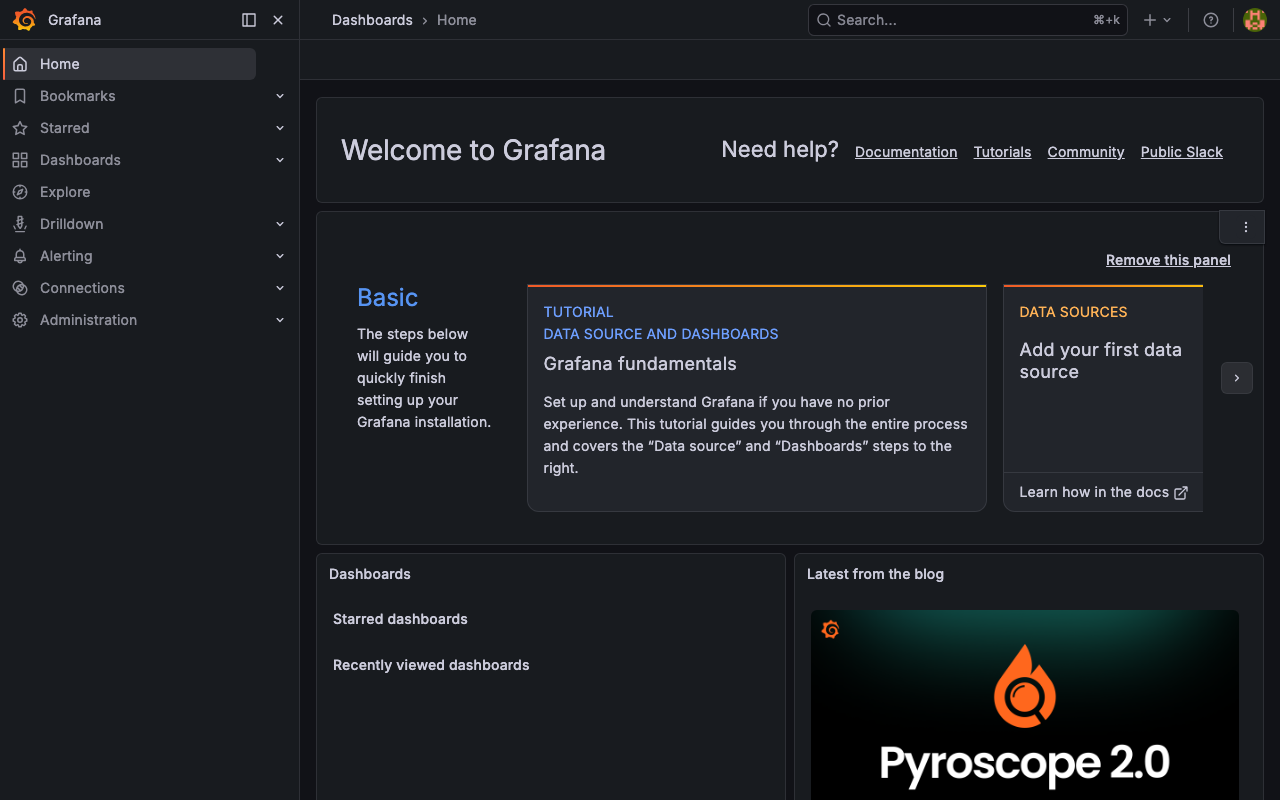
Recommended: change the admin password again from the UI (Profile → Change Password), and create per-user accounts under Administration → Users so production workflows do not run as the shared admin.
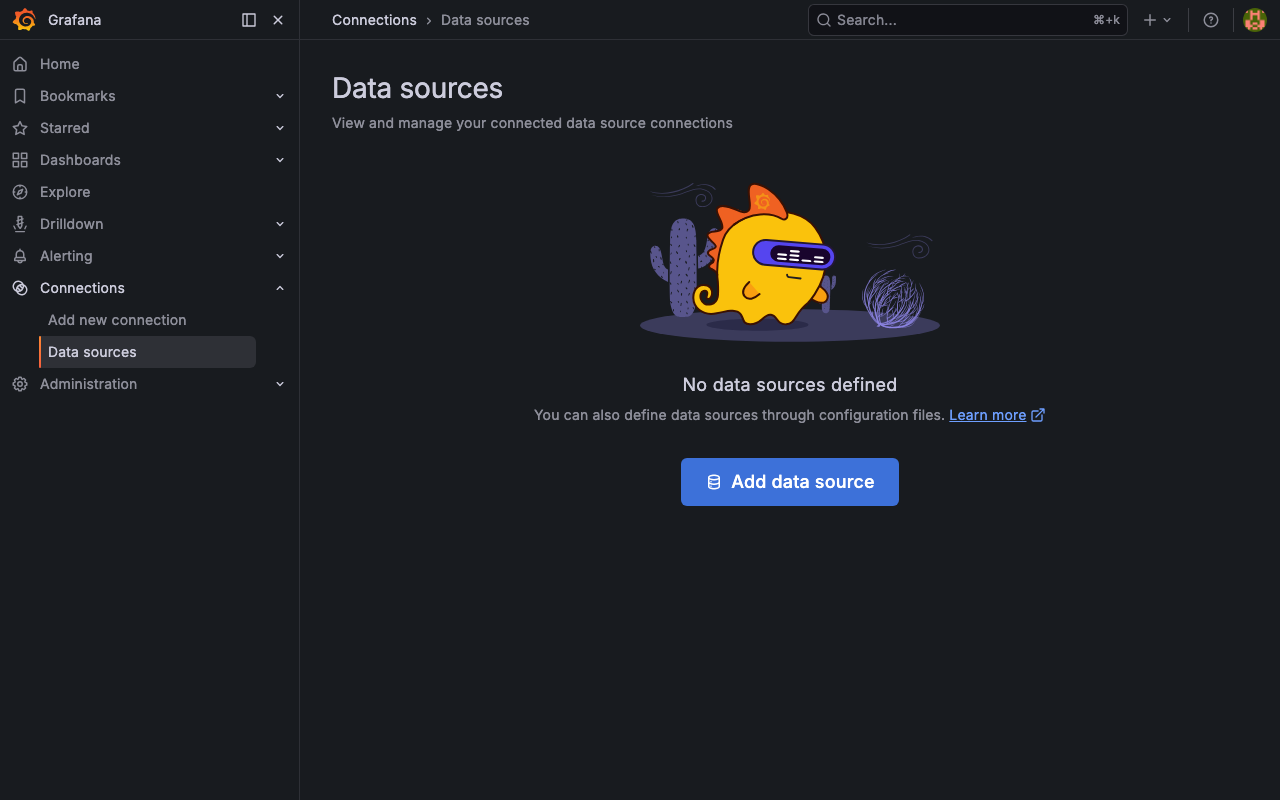
Step 7: Add a Data Source
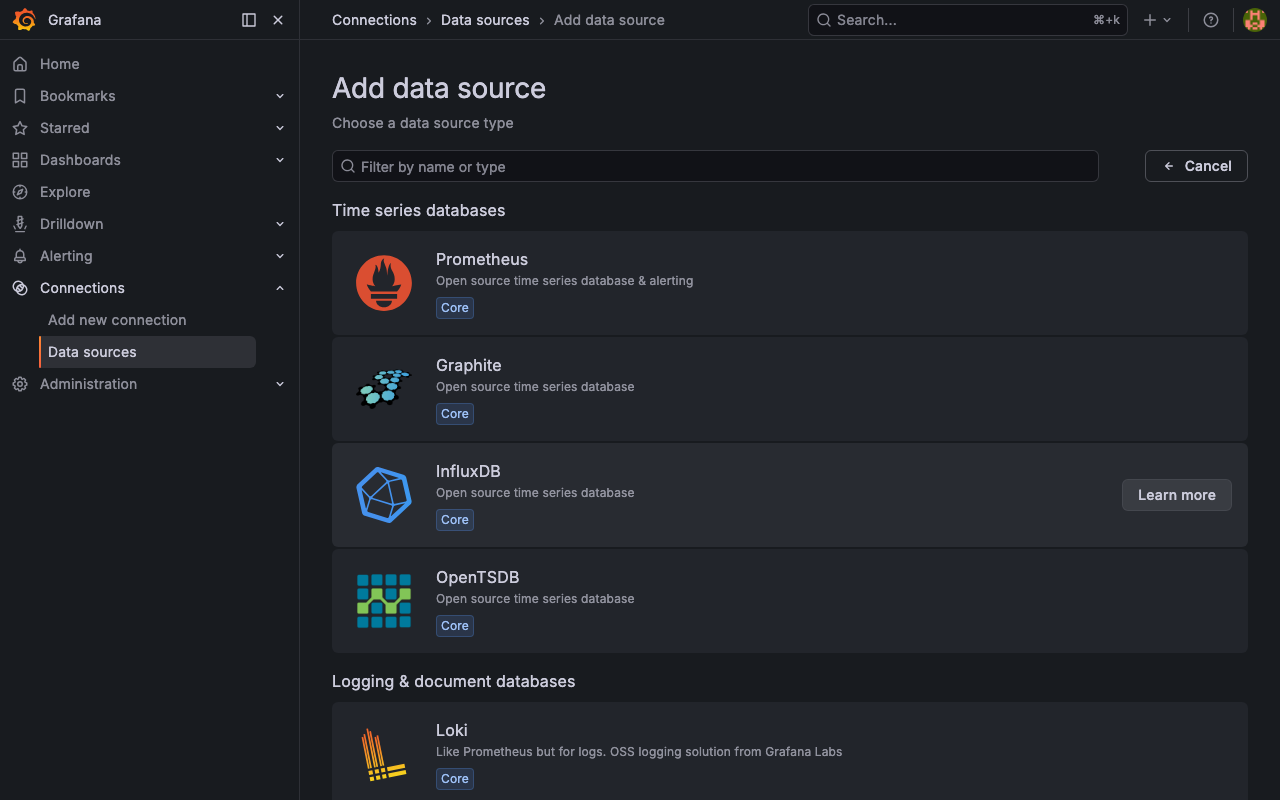
Navigate to Connections → Data sources in the left nav. On a fresh VM the list is empty — click Add data source to open the catalog:
Pick from the built-in options. Common Azure pairings:
-
Azure Monitor — built-in plugin; configure with an Azure AD service principal (Tenant ID, Client ID, Client Secret) scoped to the subscription you want to query
-
Prometheus — point at your Prometheus URL
-
PostgreSQL / MySQL / MariaDB — pair with the cloudimg
postgresql-18-pgadmin-ubuntu-24-04,mysql-9-7-lts-ubuntu-24-04, ormariadb-11-ubuntu-24-04images -
Loki — point at your Loki URL for log aggregation
-
OpenSearch / Elasticsearch — pair with the cloudimg images
After adding a data source, click Save & Test to confirm the connection.
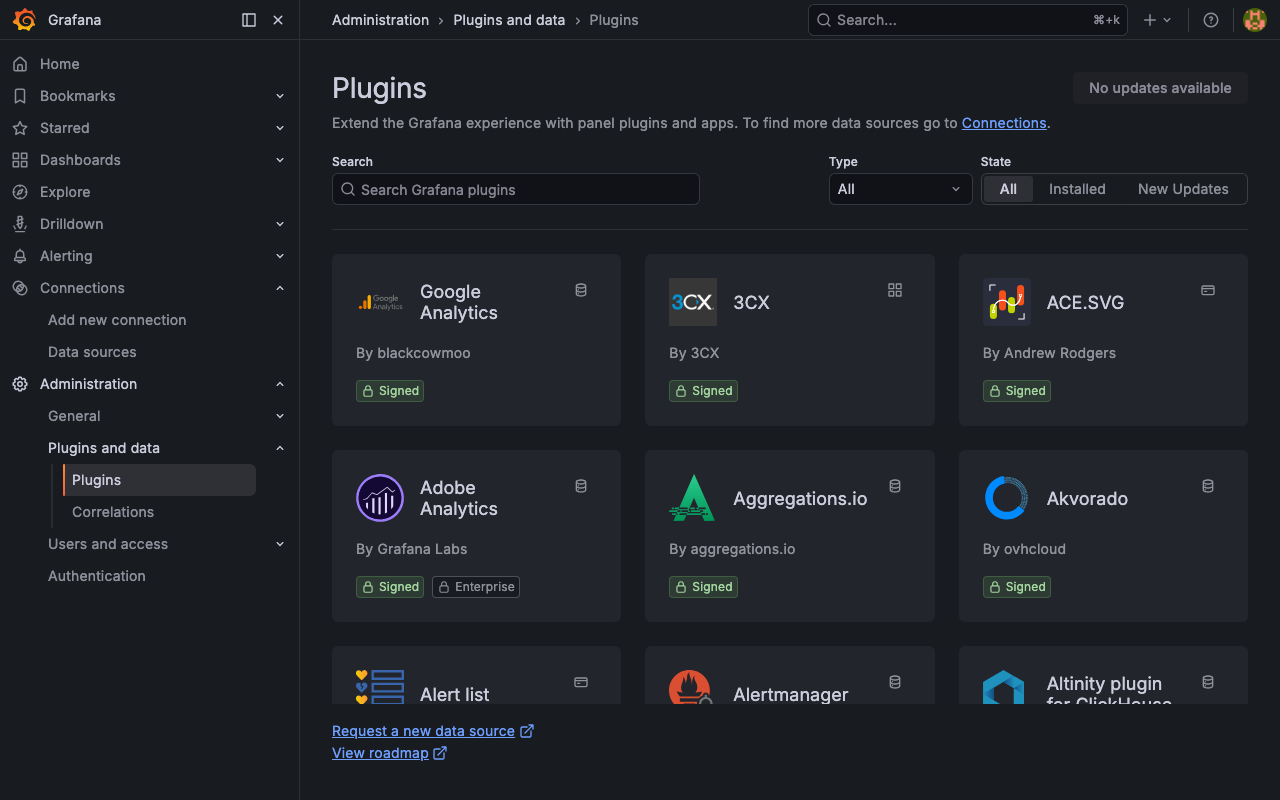
Step 8: Install Plugins
The image ships with no plugins to keep it lean. Browse the in-app plugin catalog under Administration → Plugins and data → Plugins:
Install via grafana-cli from the command line (preferred for scripted deployments):
sudo grafana-cli plugins install grafana-piechart-panel
sudo systemctl restart grafana-server.service
Repeat for each plugin you need. Browse the full catalog at https://grafana.com/grafana/plugins/.
Step 9: Put TLS in Front (Production)
Grafana 12 listens on plain HTTP by design. For production, terminate TLS at a reverse proxy. Two common paths:
Path A — Caddy / Nginx on the same VM:
sudo apt-get install -y nginx
Configure /etc/nginx/sites-available/grafana.conf with proxy_pass http://localhost:3000; and bind apache or nginx :443 to a real cert.
Path B — Azure Application Gateway in front:
Create an Application Gateway with TLS termination and route the backend pool at the VM private IP on port 3000. Restrict the NSG to allow inbound 3000 from the App Gateway subnet only.
The cloudimg nginx-ssl-certbot-ubuntu-24-04 image is purpose-built for Path A — deploy it on a separate small VM and point it at this Grafana VM's private IP.
Step 10: Server Components
Component Path
Grafana server binary /usr/sbin/grafana-server
Grafana CLI /usr/sbin/grafana-cli
Config file /etc/grafana/grafana.ini
Data directory /var/lib/grafana/
Bundled SQLite database /var/lib/grafana/grafana.db
Plugin directory /var/lib/grafana/plugins/
Log directory /var/log/grafana/
Systemd unit /usr/lib/systemd/system/grafana-server.service
Firstboot script /usr/local/sbin/grafana-firstboot.sh
Firstboot service /etc/systemd/system/grafana-firstboot.service
Credentials file /stage/scripts/grafana-credentials.log
Firstboot sentinel /var/lib/cloudimg/grafana-firstboot.done
Inspect installed package version:
dpkg-query -W -f='${Package} ${Version}\n' grafana
Confirm the package is held against major-version upgrade (so apt-get upgrade won't pull Grafana 13):
apt-mark showhold | grep grafana
Step 11: Managing the Grafana Service
Status:
sudo systemctl status grafana-server.service --no-pager
Stop / Start / Restart:
sudo systemctl stop grafana-server.service
sudo systemctl start grafana-server.service
sudo systemctl restart grafana-server.service
View logs:
sudo tail -n 50 /var/log/grafana/grafana.log
Reset admin password (e.g. if you lose it):
sudo grafana-cli admin reset-admin-password '<new-password>'
Step 12: Switch to PostgreSQL Backend (Optional, for HA)
For multi-instance deployments behind a load balancer, switch from the bundled SQLite to PostgreSQL or MySQL. Edit /etc/grafana/grafana.ini:
[database]
type = postgres
host = <postgres-host>:5432
name = grafana
user = grafana
password = <password>
Create the database and user on your PostgreSQL server first, then restart Grafana. Do not mix database backends — pick one and stick with it; switching mid-life requires a full export/import of the dashboards directory.
Step 13: Troubleshooting
Cannot reach Grafana on port 3000
-
Confirm service running:
sudo systemctl status grafana-server.service -
Confirm listener bound:
sudo ss -tln | grep 3000 -
Check log:
sudo tail -n 50 /var/log/grafana/grafana.log -
Confirm NSG allows TCP 3000 from your client source IP
Lost admin password
-
Reset via
sudo grafana-cli admin reset-admin-password '<new-password>' -
The credentials file at
/stage/scripts/grafana-credentials.logcontains the password generated at firstboot — read withsudo cat
Plugin install failed
-
Check internet connectivity from the VM (Grafana CLI fetches plugins from grafana.com)
-
Check available disk space:
df -h /var/lib/grafana -
Try with verbose logging:
sudo grafana-cli --verbose plugins install <plugin-id>
Service fails to start
-
Check journal:
sudo journalctl -u grafana-server.service --no-pager -n 100 -
Check config syntax:
sudo grafana-server --config /etc/grafana/grafana.ini --check-config -
Check filesystem space:
df -h /var/lib/grafana -
Verify data directory ownership:
sudo ls -la /var/lib/grafana | head; should begrafana:grafana
Step 14: Security Recommendations
-
Change the admin password again from the UI after first login
-
Create per-user accounts under Administration → Users; never share the admin login
-
Restrict port 22 to your management IP ranges only
-
Restrict port 3000 to trusted client networks only; pair with TLS via Step 9 for any non-trivial deployment
-
Enable Grafana built-in alerting in Production environments and route to PagerDuty, Opsgenie, Slack, or email
-
Switch to PostgreSQL backend (Step 12) if you need HA across multiple Grafana instances
-
Keep Grafana updated within the 12.x line by running
sudo apt-mark unhold grafana && sudo apt-get install grafana=12.x.y && sudo apt-mark hold grafanaperiodically (replace 12.x.y with the latest 12 release) -
Shred the credentials file once the password is stored in your secret store:
sudo shred -u /stage/scripts/grafana-credentials.log
Step 15: Support and Licensing
Grafana OSS is licensed under the GNU Affero General Public License version 3 (AGPLv3). There is no per-user, per-dashboard, or per-server fee. Grafana is a registered trademark of Grafana Labs.
cloudimg provides commercial support for this image separately from the upstream project.
-
Email: support@cloudimg.co.uk
-
Website: www.cloudimg.co.uk
-
Support hours: 24/7 with guaranteed 24 hour response SLA
Deploy on Azure
Launch Grafana 12 OSS on Ubuntu 24.04 with 24/7 support from cloudimg.
View on Marketplace
Need Help?
Our support team is available 24/7.
support@cloudimg.co.uk