
Grafana Alloy on AWS User Guide
Overview
Grafana Alloy is a vendor neutral distribution of the OpenTelemetry Collector. It collects, processes and forwards telemetry, metrics, logs, traces and profiles, using a single declarative configuration built from composable components, and it can ship that data to Prometheus, Grafana Cloud, Mimir, Loki, Tempo, Pyroscope and any OpenTelemetry compatible backend. A built in web UI renders the live component graph and the health of every component, so you can see exactly how telemetry flows through your pipeline. It is a single Go binary managed by systemd, so it stays lightweight and starts instantly.
The cloudimg image installs Grafana Alloy 1.17.1 from Grafana's official package repository and puts the web UI behind an nginx reverse proxy. Because the Alloy UI has no built in authentication, the appliance is secure by default: Alloy is bound to loopback only, and nginx fronts it on port 80 behind an HTTP Basic Auth gate whose password is generated uniquely and at random on the first boot of every instance, so no shared or default credential is ever baked into the image. A sensible, fully self contained demo pipeline scrapes Alloy's own metrics, tags and batches them and logs a summary locally, so every component is healthy and the component graph is populated on first boot, with nothing leaving the instance. You replace the demo pipeline with your own whenever you are ready.
What is included:
- Grafana Alloy 1.17.1 single Go binary (
/usr/bin/alloy), installed from Grafana's official apt repository and version pinned alloy.servicerunning as thealloyuser, with the web UI bound to loopback127.0.0.1:12345nginx.servicereverse proxy on TCP 80 with a per instance HTTP Basic Auth gate (useradmin), TLS readygrafana-alloy-firstboot.servicegenerating the per instance password and resolving this instance's URL into the MOTD and a root only info note on first boot- An unauthenticated static
/healthzendpoint for load balancer and probe checks - A self contained demo pipeline in
/etc/alloy/config.alloyso the component graph is live and populated out of the box - Ubuntu 24.04 LTS base, latest patches, unattended security upgrades enabled
Prerequisites
An active AWS account, an EC2 key pair, and a VPC with a subnet. Recommended instance type: m5.large (Alloy is light for a demo pipeline; scale up for heavier collection workloads).
Step 1: Launch from the AWS Marketplace
Find Grafana Alloy on the AWS Marketplace, subscribe, and launch an instance. In the launch wizard, attach a security group that allows inbound TCP 22 (SSH) and TCP 80 (the UI, behind HTTP Basic Auth) from your client networks only. Put a TLS listener or reverse proxy in front of port 80 for production (Step 13).
Step 2: Launch from the AWS CLI
AMI_ID="<marketplace-ami-id>"        # from the Marketplace listing, in your region
KEY_NAME="my-key"
SUBNET_ID="subnet-xxxxxxxx"
SG_ID="sg-xxxxxxxx"                    # allows 22 + 80 from your networks only
aws ec2 run-instances \
  --image-id "$AMI_ID" --instance-type m5.large \
  --key-name "$KEY_NAME" --subnet-id "$SUBNET_ID" \
  --security-group-ids "$SG_ID" \
  --metadata-options 'HttpTokens=required' \
  --block-device-mappings '[{"DeviceName":"/dev/sda1","Ebs":{"VolumeType":"gp3","VolumeSize":30}}]' \
  --tag-specifications 'ResourceType=instance,Tags=[{Key=Name,Value=grafana-alloy}]'
Connecting to your instance
Connect over SSH as the login user for your image's operating system. alloy.service, nginx.service and grafana-alloy-firstboot.service all start automatically on first boot.
| Operating system | SSH login user | Connect |
|---|---|---|
| Ubuntu 24.04 LTS | ubuntu |
ssh -i my-key.pem ubuntu@<instance-public-ip> |
Step 3: Retrieve the Per-Instance Password
On first boot the appliance generates a random HTTP Basic Auth password for user admin, unique to this instance, and writes it to a root only file. There is no shared or default credential in the image. Read it over SSH:
sudo cat /root/grafana-alloy-credentials.txt
The file holds this instance's URL, username and password:
ALLOY_URL=http://<instance-public-ip>/
ALLOY_USERNAME=admin
ALLOY_PASSWORD=<unique-per-instance-password>
Keep this password safe — it is the only credential for the web UI, and every instance gets a different one.
Step 4: Verify the Services
sudo systemctl is-active alloy nginx grafana-alloy-firstboot
sudo test -f /var/lib/cloudimg/grafana-alloy-firstboot.done && echo FIRSTBOOT_DONE
sudo ss -tlnp | grep -E ':80 |:12345 '
Expected output — all three services are active, nginx is bound to the public port 80 and the Alloy UI is bound to loopback 127.0.0.1:12345 only:
active
active
active
FIRSTBOOT_DONE
LISTEN 0 511         0.0.0.0:80        0.0.0.0:*
LISTEN 0 4096      127.0.0.1:12345     0.0.0.0:*
LISTEN 0 511            [::]:80           [::]:*
Step 5: Secure by Default — the Auth Gate
The Alloy UI has no built in login, so nginx fronts it with an HTTP Basic Auth gate. An unauthenticated /healthz is available for load balancer probes, but the UI itself is gated: unauthenticated and wrong password requests are rejected with 401, and only the per instance password is accepted. Read your password from the file and prove the gate:
PW=$(sudo grep '^ALLOY_PASSWORD=' /root/grafana-alloy-credentials.txt | cut -d= -f2-)
curl -s -o /dev/null -w 'GET /healthz (unauth)   -> HTTP %{http_code}\n' http://127.0.0.1/healthz
curl -s -o /dev/null -w 'GET / (no credential)   -> HTTP %{http_code}\n' http://127.0.0.1/
curl -s -o /dev/null -w 'GET / (wrong password)  -> HTTP %{http_code}\n' -u admin:wrong http://127.0.0.1/
curl -s -o /dev/null -w 'GET / (per-instance pw) -> HTTP %{http_code}\n' -u "admin:$PW" http://127.0.0.1/
The health probe is open, the UI is gated, a wrong password is rejected, and the per instance password authenticates:
GET /healthz (unauth)   -> HTTP 200
GET / (no credential)   -> HTTP 401
GET / (wrong password)  -> HTTP 401
GET / (per-instance pw) -> HTTP 200
Step 6: Open the Component Graph
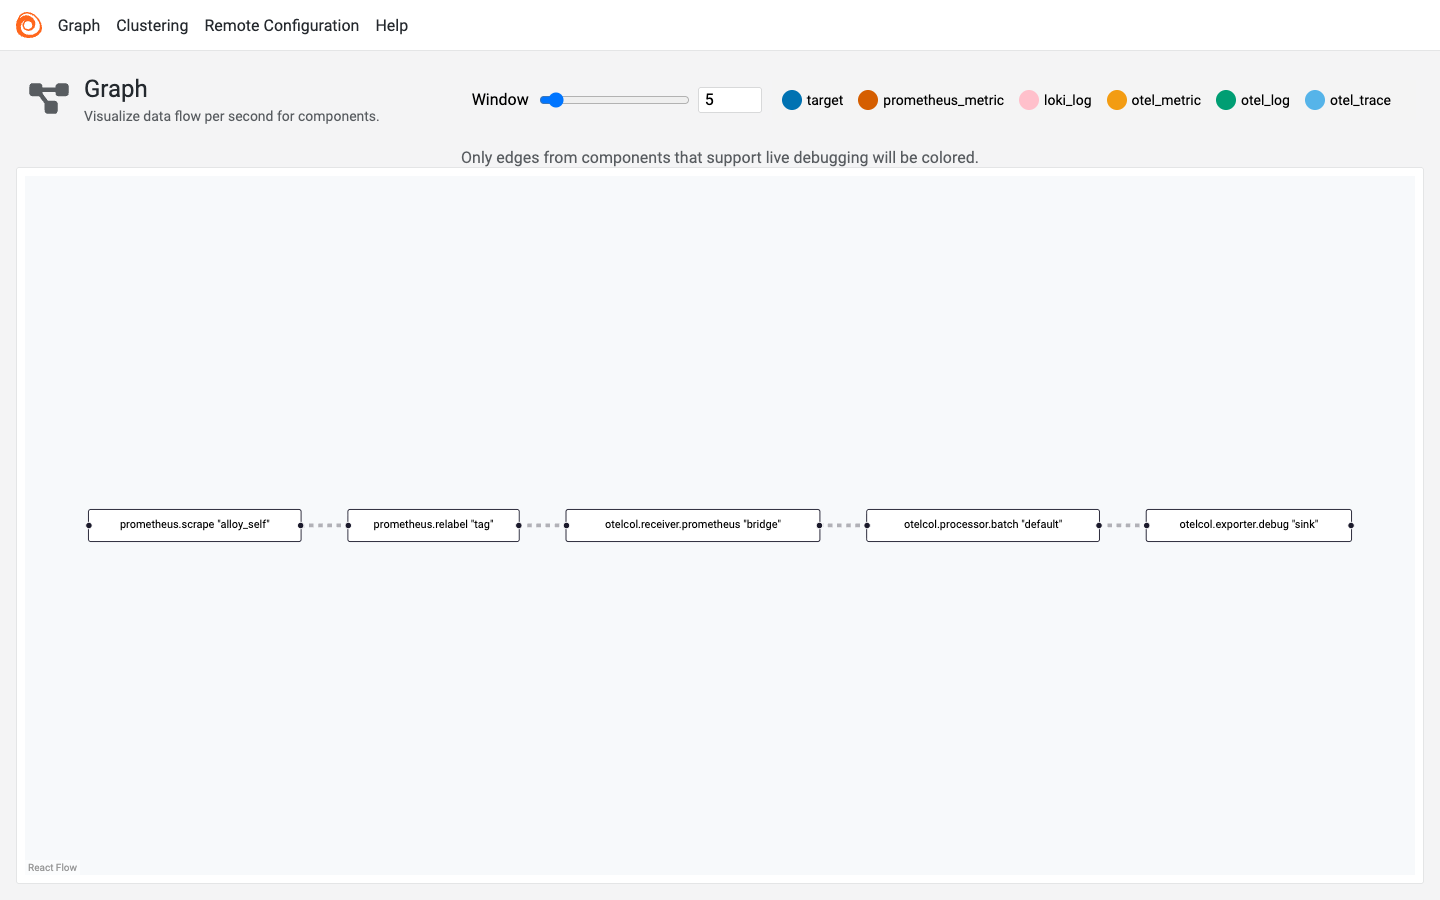
Open http://<instance-public-ip>/ in a browser and sign in as admin with the password from Step 3. The Graph view visualizes the live pipeline: telemetry flows left to right through each component, from collection through processing to the sink.
Step 7: Review Component Health
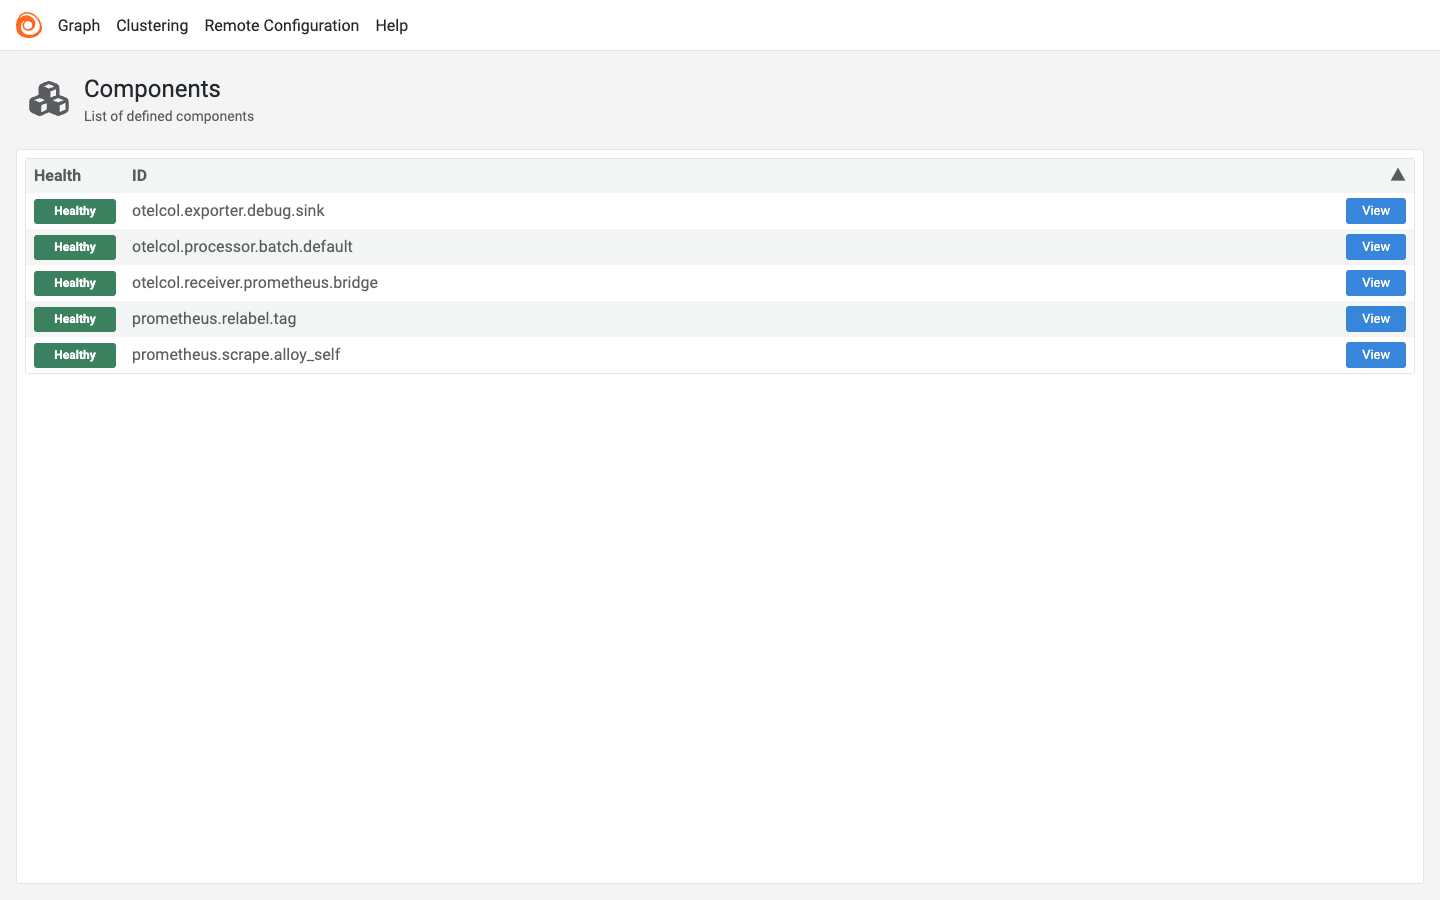
The Components view lists every component in your pipeline with its health. In this self contained demo every component reports Healthy on first boot, because nothing depends on an external endpoint being reachable.
Step 8: Inspect a Component
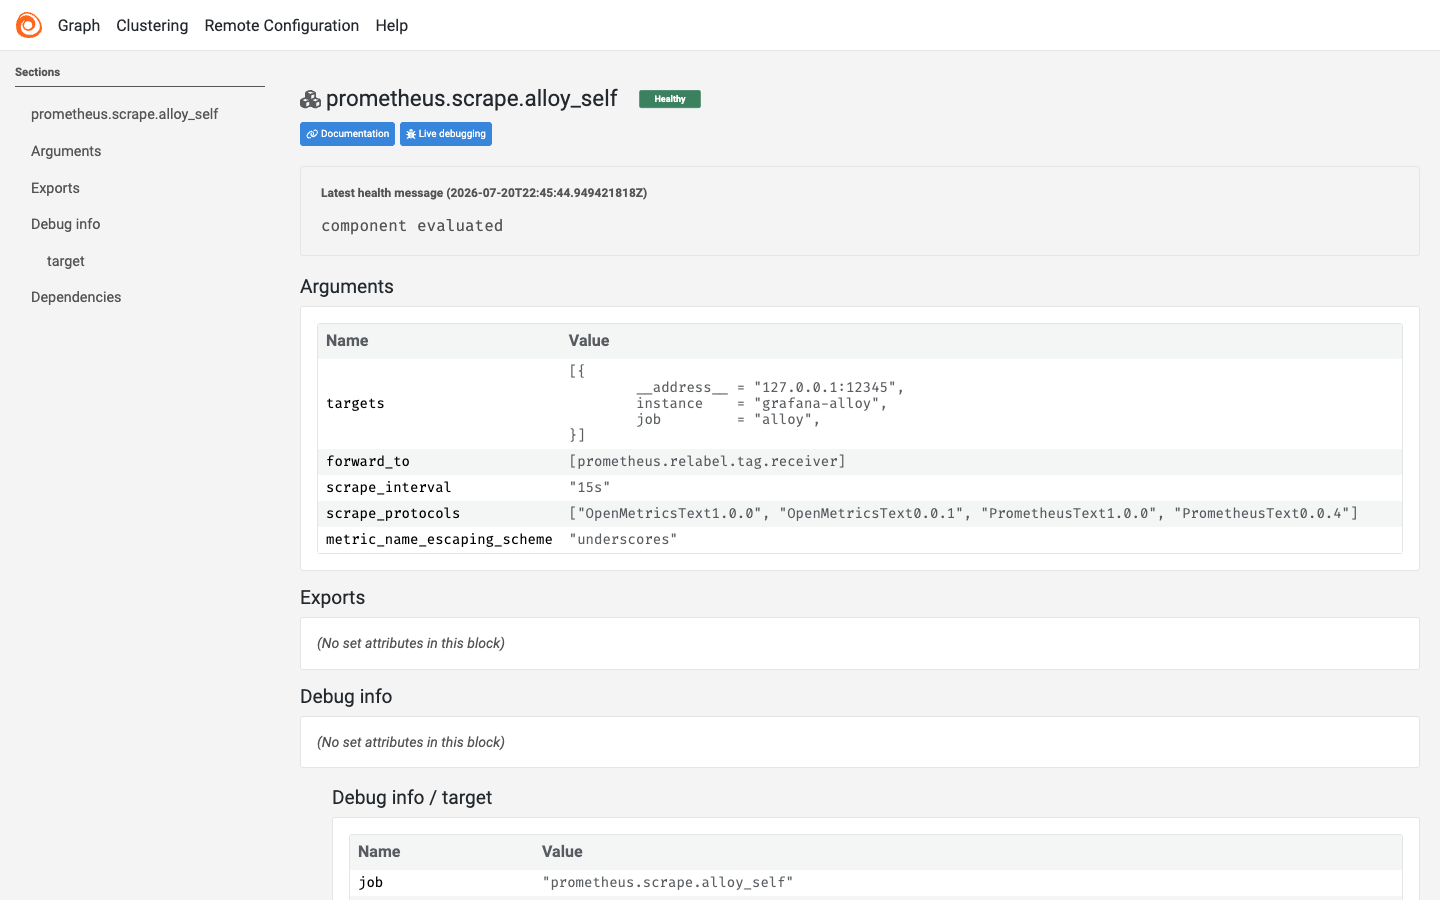
Click View on any component to open its detail page. Each component shows a Healthy badge, its latest health message, its arguments, its exports and its dependencies. The prometheus.scrape component is the collection stage — here it scrapes Alloy's own metrics endpoint every 15 seconds and forwards the results to the next component.
Step 9: Check Component Health via the API
Everything the UI shows is also available as JSON at /api/v0/web/components, so you can wire Alloy's health into your own tooling. Read your password from the file and query it:
PW=$(sudo grep '^ALLOY_PASSWORD=' /root/grafana-alloy-credentials.txt | cut -d= -f2-)
curl -s -u "admin:$PW" http://127.0.0.1/api/v0/web/components \
  | jq '[.[] | {component: .localID, health: .health.state}]'
Every component in the demo pipeline reports healthy:
[
  { "component": "otelcol.exporter.debug.sink",       "health": "healthy" },
  { "component": "otelcol.processor.batch.default",    "health": "healthy" },
  { "component": "otelcol.receiver.prometheus.bridge", "health": "healthy" },
  { "component": "prometheus.relabel.tag",             "health": "healthy" },
  { "component": "prometheus.scrape.alloy_self",       "health": "healthy" }
]
Step 10: The Demo Pipeline Config
The whole pipeline is defined in one declarative file, /etc/alloy/config.alloy. Check the version, view it and validate it:
/usr/bin/alloy --version | head -1
cat /etc/alloy/config.alloy
alloy fmt /etc/alloy/config.alloy >/dev/null && echo "config valid"
The pinned binary and the self contained demo pipeline validate cleanly:
alloy, version v1.17.1 (branch: HEAD, revision: 76a2e2a)
config valid
Step 11: Customize the Pipeline
Replace the demo pipeline with your own. Edit /etc/alloy/config.alloy with sudo nano /etc/alloy/config.alloy — for example, to scrape a local application and forward its metrics to Grafana Cloud or your own Prometheus, using a components pattern like this:
prometheus.scrape "my_app" {
  targets = [
    { "__address__" = "127.0.0.1:8080", "job" = "my-app" },
  ]
  forward_to = [prometheus.remote_write.default.receiver]
}

prometheus.remote_write "default" {
  endpoint {
    url = "https://<your-prometheus>/api/v1/write"
  }
}
Validate your changes with alloy fmt /etc/alloy/config.alloy, then apply them with sudo systemctl reload alloy (Alloy reloads its config without a full restart). The full component reference is at grafana.com/docs/alloy.
Step 12: Managing the Service
sudo systemctl show alloy --property=ActiveState,SubState,MainPID,NRestarts
Alloy is managed by systemd, so it restarts automatically on failure and on boot:
MainPID=2000
NRestarts=0
ActiveState=active
SubState=running
Reload its config after an edit with sudo systemctl reload alloy, or restart it fully with sudo systemctl restart alloy. Logs, including the demo sink's telemetry summaries, are available with sudo journalctl -u alloy -f.
Step 13: Add TLS (Optional)
For production, terminate TLS at nginx. Point a DNS record at the instance, allow inbound TCP 443 in the security group, then use the packaged nginx with a certificate from Let's Encrypt:
sudo apt-get install -y certbot python3-certbot-nginx
sudo certbot --nginx -d <your-domain>
certbot installs the certificate, rewrites the nginx server block to listen on 443 and sets up automatic renewal. The HTTP Basic Auth gate stays in front of the UI over TLS.
Step 14: Security Recommendations
- Restrict the security group so ports 80 and 22 only reach trusted networks.
- Terminate TLS at nginx (Step 13) so the UI and its Basic Auth credentials travel encrypted.
- Rotate the Basic Auth password if needed by regenerating
/etc/nginx/.alloy.htpasswdwithsudo htpasswd -B /etc/nginx/.alloy.htpasswd adminand reloading nginx. - Keep the UI private — the Alloy UI can trigger config reloads and expose pipeline internals, so treat access as privileged even behind Basic Auth.
- Review your pipeline's exporters so telemetry only leaves the instance to the backends you intend.
- Patch the OS monthly with
sudo apt-get update && sudo apt-get upgrade; unattended security upgrades are already enabled.
Step 15: Support and Licensing
Grafana Alloy is licensed under the Apache License 2.0 — no per CPU or per user fee. cloudimg provides commercial support separately.
- Email: support@cloudimg.co.uk
- Website: www.cloudimg.co.uk
- Support hours: 24/7, 24h response SLA
Deploy on AWS
Launch Grafana Alloy with 24/7 support from cloudimg.
View on Marketplace
Need Help?
Our support team is available 24/7. support@cloudimg.co.uk