GreptimeDB on AWS User Guide
Overview
This image runs GreptimeDB, the fast, open source, unified observability database for metrics, logs and traces. GreptimeDB speaks SQL and PromQL, ingests over the MySQL and PostgreSQL wire protocols, the Prometheus remote write protocol, the Influx line protocol, OpenTelemetry and its own HTTP API, and stores everything in one columnar engine.
The GreptimeDB standalone binary is installed under /opt/greptimedb and runs as a dedicated unprivileged greptime system account under a systemd service that starts it on boot and restarts it on failure. The database lives at /var/lib/greptimedb, which is a dedicated, independently resizable EBS data volume.
The open source GreptimeDB dashboard ships with no built in authentication, so the database HTTP server binds to the loopback interface only and is never exposed directly. An nginx reverse proxy publishes the web dashboard and the SQL, PromQL and ingest APIs on port 80 behind HTTP Basic authentication. The admin password is generated on the first boot of every deployed instance, so two instances launched from the same Amazon Machine Image never share a password. It is written to /root/greptimedb-credentials.txt with mode 0600 so that only the root user can read it. A small demo table is seeded on first boot so the dashboard has data to explore immediately.
Prerequisites
Before you deploy this image you need:
- An Amazon Web Services account where you can launch EC2 instances
- IAM permissions to launch instances, create security groups, and subscribe to AWS Marketplace products
- An EC2 key pair in the target Region for SSH access to the instance
- A VPC and subnet in the target Region, with a security group allowing inbound port 22 from your management network and port 80 for the web dashboard and the read and write APIs
- The AWS CLI (version 2) installed locally if you plan to deploy from the command line
Step 1: Launch the Instance from the AWS Marketplace
Sign in to the AWS Management Console, open the EC2 service, and select Launch instance. Under Application and OS Images choose AWS Marketplace AMIs and search for GreptimeDB. Select the cloudimg listing and choose Select, then Continue on the subscription summary.
Pick an instance type of t3.small or larger. Choose your EC2 key pair under Key pair (login). Under Network settings select your VPC and subnet, and either create or select a security group that opens port 22 from your management network and port 80 for the dashboard and the APIs. Leave the root volume at the default size or larger.
Select Launch instance. First boot initialisation takes a few seconds after the instance state becomes Running and the status checks pass.
Step 2: Launch the Instance from the AWS CLI
The following block launches an instance from the cloudimg GreptimeDB Marketplace AMI into an existing subnet and security group. Replace <ami-id> with the AMI ID shown on the Marketplace listing, <key-name> with your EC2 key pair name, <subnet-id> with your subnet ID, and <security-group-id> with a security group that opens ports 22 and 80 as described above.
aws ec2 run-instances \
  --image-id <ami-id> \
  --instance-type t3.small \
  --key-name <key-name> \
  --subnet-id <subnet-id> \
  --security-group-ids <security-group-id> \
  --tag-specifications 'ResourceType=instance,Tags=[{Key=Name,Value=greptimedb}]'
When the instance reaches the Running state and its status checks pass, note its public IP address or DNS name from the EC2 console or with aws ec2 describe-instances.
Step 3: Connect to Your Instance
Connect over SSH using your key pair and the login user for your operating system variant.
| OS variant | SSH login user |
|---|---|
| Ubuntu 24.04 | ubuntu |
ssh -i <key-name>.pem ubuntu@<public-ip>
Step 4: Retrieve the Admin Password
The dashboard admin password is unique to your instance and was generated on first boot. Read it as root:
sudo cat /root/greptimedb-credentials.txt
The file lists the dashboard URL, the admin user (admin) and the generated password, along with the API endpoint URLs. Keep this password somewhere safe.
Step 5: Sign In to the Web Dashboard
The GreptimeDB web dashboard is served on port 80 by nginx behind HTTP Basic authentication. In a browser, go to:
http://<instance-public-ip>/
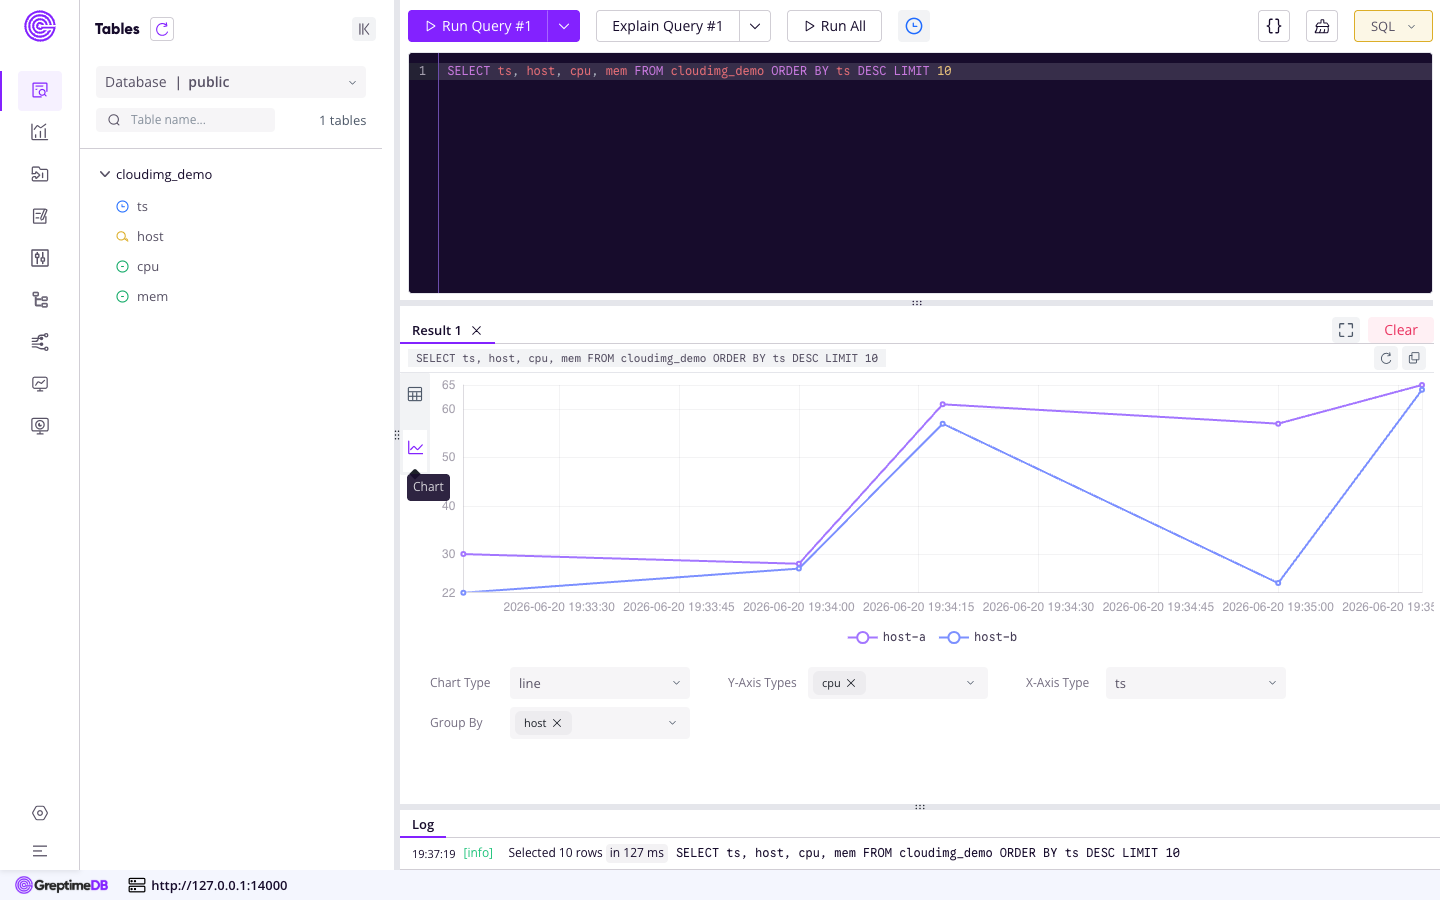
You are prompted for credentials. Sign in as admin with the password from the credentials file. The bare root redirects to the dashboard, where the query console lets you run a SQL or PromQL statement and view the result as a table or chart.
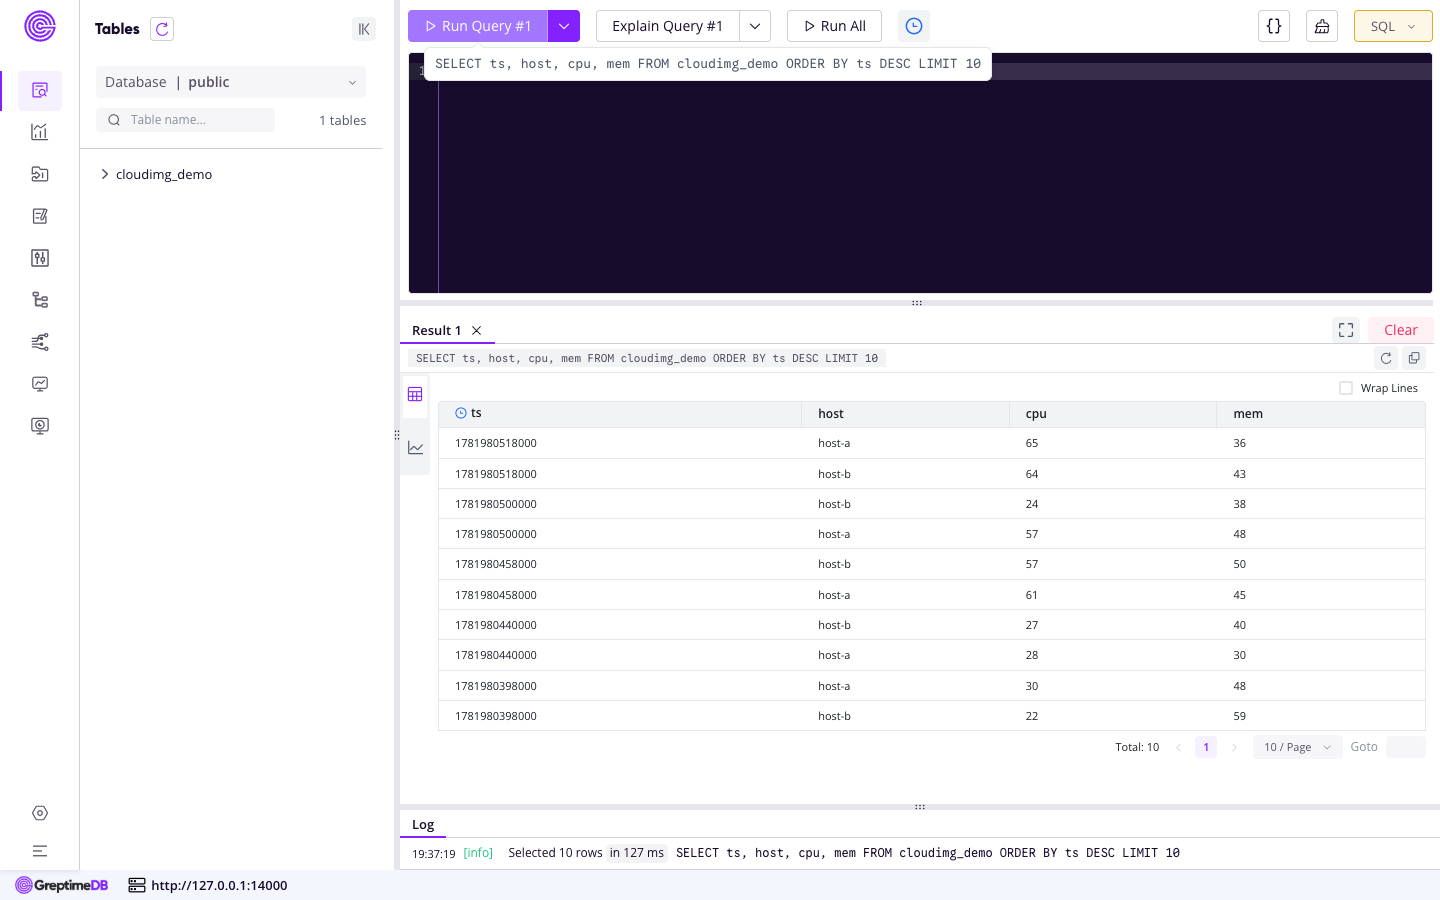
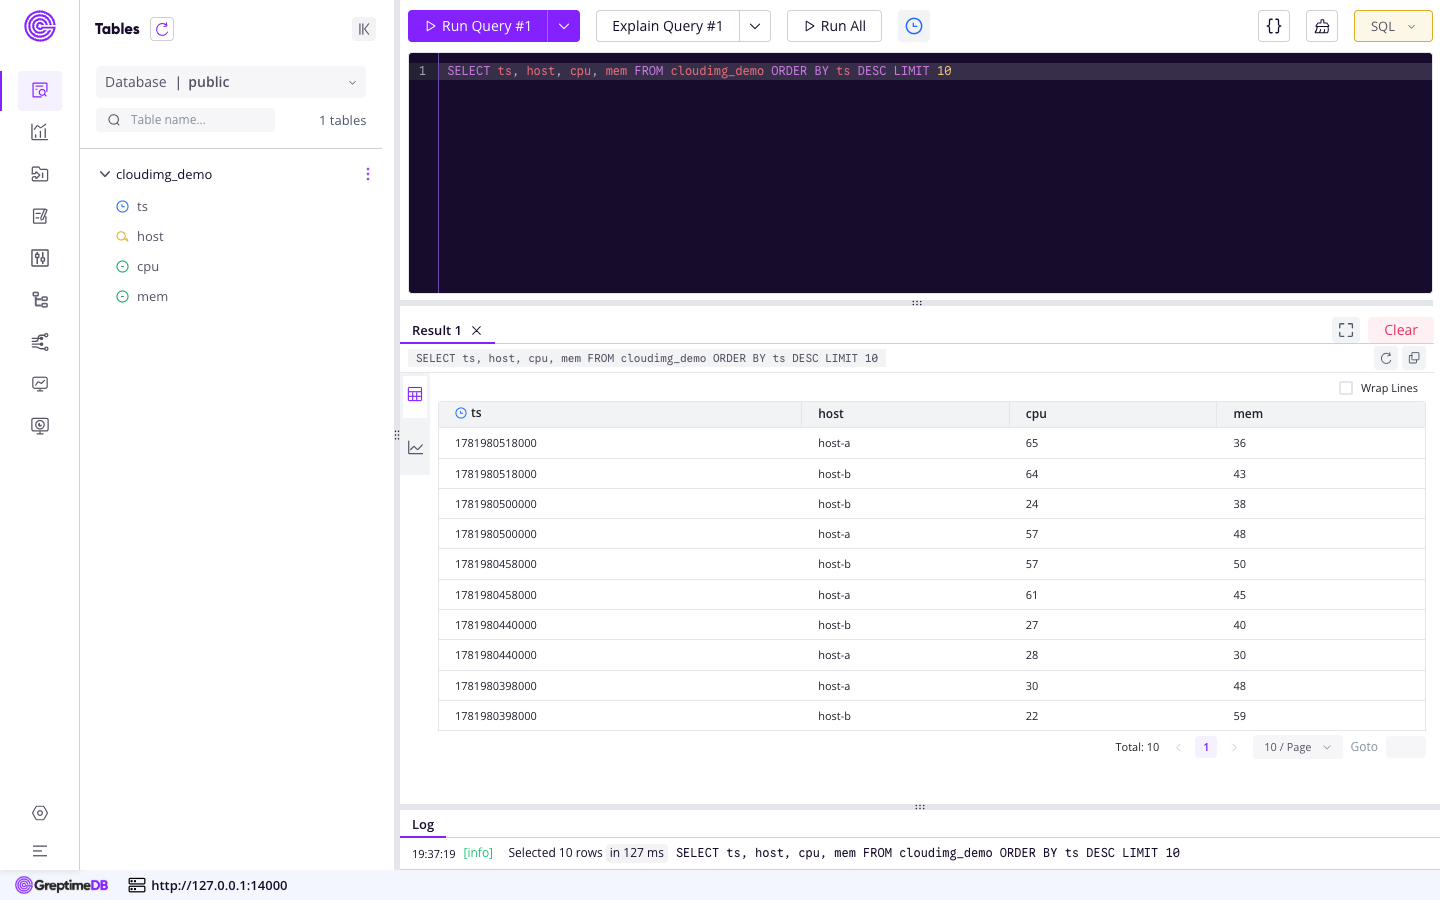
The dashboard lists the database tables and the column schema of each table, so you can browse what is stored and inspect the time index and the column types.
The query console also drives ingestion and exploration: write data with SQL INSERT statements or an ingest protocol, then query it straight back with SQL or PromQL.
Step 6: Confirm GreptimeDB Is Running
Over SSH, confirm the database and the nginx proxy are active and that the ports are listening:
sudo systemctl is-active greptimedb nginx
sudo ss -tlnp | grep -E ':(80|4000|4002|4003) '
You should see both services reported as active, the database HTTP server listening on 127.0.0.1:4000 (loopback only) along with the MySQL listener on 127.0.0.1:4002 and the PostgreSQL listener on 127.0.0.1:4003, and nginx listening on port 80.
Step 7: Run a Query
You can query GreptimeDB through the dashboard, the HTTP SQL API, or any MySQL or PostgreSQL client. On the instance you can run a SQL query over loopback without credentials:
curl -s -X POST http://127.0.0.1:4000/v1/sql \
  -H 'Content-Type: application/x-www-form-urlencoded' \
  --data-urlencode 'sql=SELECT host, cpu, mem FROM cloudimg_demo ORDER BY ts DESC LIMIT 5'
From outside the instance, send the same request to http://<instance-public-ip>/v1/sql with basic auth user admin and the generated password. List the tables in the database with:
curl -s -X POST http://127.0.0.1:4000/v1/sql \
  -H 'Content-Type: application/x-www-form-urlencoded' \
  --data-urlencode 'sql=SHOW TABLES'
Step 8: Ingest Data
GreptimeDB accepts data over several protocols on port 80 through the authenticating proxy. Point your existing agents at the instance using the admin credentials:
- Prometheus remote write — set the
remote_writeURL in your Prometheus or vmagent config tohttp://<instance-public-ip>/v1/prometheus/writewith basic auth useradmin. - Influx line protocol — send to
http://<instance-public-ip>/v1/influxdb/write. - OpenTelemetry — send OTLP metrics, logs and traces to the OpenTelemetry endpoints under
http://<instance-public-ip>/v1/otlp. - SQL — insert rows directly with
INSERT INTO ...over the HTTP SQL API, the MySQL client or the PostgreSQL client.
Insert a row over loopback to confirm ingestion works:
curl -s -X POST http://127.0.0.1:4000/v1/sql \
  -H 'Content-Type: application/x-www-form-urlencoded' \
  --data-urlencode "sql=INSERT INTO cloudimg_demo (ts, host, cpu, mem) VALUES (now(), 'host-c', 42.0, 55.0)"
Step 9: Connect a MySQL or PostgreSQL Client
GreptimeDB speaks the MySQL and PostgreSQL wire protocols. The listeners bind to loopback on the instance (ports 4002 and 4003), so connect from the instance itself or tunnel the port over SSH first. From the instance:
mysql -h 127.0.0.1 -P 4002 -u greptime public -e 'SELECT count(*) FROM cloudimg_demo;'
To reach the MySQL listener from your workstation, open an SSH tunnel and point your client at the local end:
ssh -i <key-name>.pem -L 4002:127.0.0.1:4002 ubuntu@<public-ip>
Step 10: Connect Grafana
Add GreptimeDB to Grafana with the official GreptimeDB data source plugin, or use the Prometheus data source for PromQL panels and the MySQL data source for SQL panels. For the Prometheus data source, set the URL to http://<instance-public-ip>/v1/prometheus, enable Basic auth, and enter user admin with the generated password. GreptimeDB answers the Prometheus query API, so existing Prometheus dashboards work, and you can additionally write SQL panels against the same data.
Step 11: The Data Volume
The database lives on a dedicated EBS volume mounted at /var/lib/greptimedb. This keeps the observability data off the operating system disk and lets you resize or snapshot it independently. Confirm the mount with:
df -h /var/lib/greptimedb
To grow the store, expand the EBS volume in the AWS console, then grow the filesystem on the instance with sudo resize2fs on the underlying device. The storage data_home is set in /etc/greptimedb/standalone.toml.
Step 12: Enable HTTPS
The dashboard and APIs are served over plain HTTP on port 80 by nginx. For production use, place them behind TLS. Obtain a certificate for your domain (for example with a managed certificate on an Application Load Balancer in front of the instance, or with Certbot installed on the instance), then configure nginx to listen on 443 with your certificate and proxy to 127.0.0.1:4000 exactly as the bundled site does for port 80, keeping the HTTP Basic authentication in place. Restrict the security group so ports 80 and 443 are reachable only from the networks that ingest and query data.
Step 13: Backup and Maintenance
Back up the database by snapshotting the /var/lib/greptimedb EBS volume, which captures the entire store. Apply operating system security updates with sudo apt-get update && sudo apt-get upgrade and reboot when a new kernel is installed; GreptimeDB and nginx start automatically on boot.
Support
This image is published and supported by cloudimg. Support covers deployment, ingestion protocol configuration, retention and compaction, SQL and PromQL queries, Grafana integration, TLS and storage tuning. Contact cloudimg through the support channel listed on the AWS Marketplace listing.
All product and company names are trademarks or registered trademarks of their respective holders. Use of them does not imply any affiliation with or endorsement by them.