GreptimeDB on Ubuntu 24.04 on Azure User Guide
Overview
GreptimeDB is an open-source, cloud-native time-series database for metrics, logs and events. It speaks SQL and PromQL and accepts ingestion over the InfluxDB, OpenTSDB and Prometheus protocols, so it slots into existing observability and IoT pipelines without re-tooling your collectors. The cloudimg image installs GreptimeDB 1.1.1 as the single greptime binary at /usr/local/bin/greptime, runs it in standalone mode as a dedicated greptimedb system user, binds every listener to loopback behind an nginx reverse proxy on TCP 80 with HTTP Basic auth, persists all data on a dedicated Azure data disk, and generates a unique web password on the first boot of every VM. The web Dashboard gives you an immediate SQL/PromQL query console with table and chart views. Backed by 24/7 cloudimg support.
What is included:
- GreptimeDB 1.1.1 (standalone) at
/usr/local/bin/greptime - The web Dashboard, the SQL-over-HTTP API and the PromQL API, fronted by nginx on
:80 - nginx HTTP Basic auth (GreptimeDB's HTTP API has no built-in authentication) with a per-VM password in a root-only file
- A dedicated Azure data disk at
/var/lib/greptimedbholding all time-series data — separate from the OS disk and re-provisioned with every VM - SQL, PromQL and InfluxDB / OpenTSDB / Prometheus ingestion endpoints behind the same auth wall
greptimedb.service+nginx.serviceas systemd units, enabled and active- 24/7 cloudimg support
Prerequisites
An active Azure subscription, an SSH key pair, and a VNet + subnet in the target region. Standard_B2ms (2 vCPU / 8 GiB RAM) is a good starting point; scale up for higher ingestion rates and cardinality. NSG inbound: allow 22/tcp from your management network and 80/tcp for the Dashboard and API (front with TLS for public exposure — see Enabling HTTPS).
Step 1 — Deploy from the Azure Marketplace
Sign in to the Azure Portal, choose Create a resource, search the Marketplace for GreptimeDB by cloudimg, and select Create. On Basics pick your subscription, resource group, region and size; under Administrator account choose SSH public key and paste your key; under Inbound port rules allow SSH (22) and HTTP (80). Review the dedicated data disk on the Disks tab, then Review + create → Create.
Step 2 — Deploy from the Azure CLI
az vm create \
  --resource-group <your-rg> \
  --name greptimedb \
  --image <marketplace-image-urn> \
  --size Standard_B2ms \
  --admin-username azureuser \
  --ssh-key-values ~/.ssh/id_ed25519.pub \
  --vnet-name <your-vnet> --subnet <your-subnet> \
  --public-ip-sku Standard

az vm open-port --resource-group <your-rg> --name greptimedb --port 80 --priority 1010
Step 3 — Connect to your VM
ssh azureuser@<vm-public-ip>
Step 4 — Confirm the services are running
systemctl is-active greptimedb.service nginx.service
Both services report active. GreptimeDB starts in seconds and is ready to accept SQL, PromQL and line-protocol traffic immediately.
Step 5 — Retrieve your web password
The admin password is generated uniquely on the first boot of your VM and written to a root-only file:
sudo cat /root/greptimedb-credentials.txt
This file contains GREPTIMEDB_ADMIN_USER (admin) and GREPTIMEDB_ADMIN_PASSWORD, plus the URLs for the Dashboard and API. Store the password somewhere safe.
Step 6 — Check the health endpoint
nginx serves an unauthenticated health endpoint for load balancers and probes:
curl -s http://localhost/health
It returns ok.
Step 7 — Open the web Dashboard
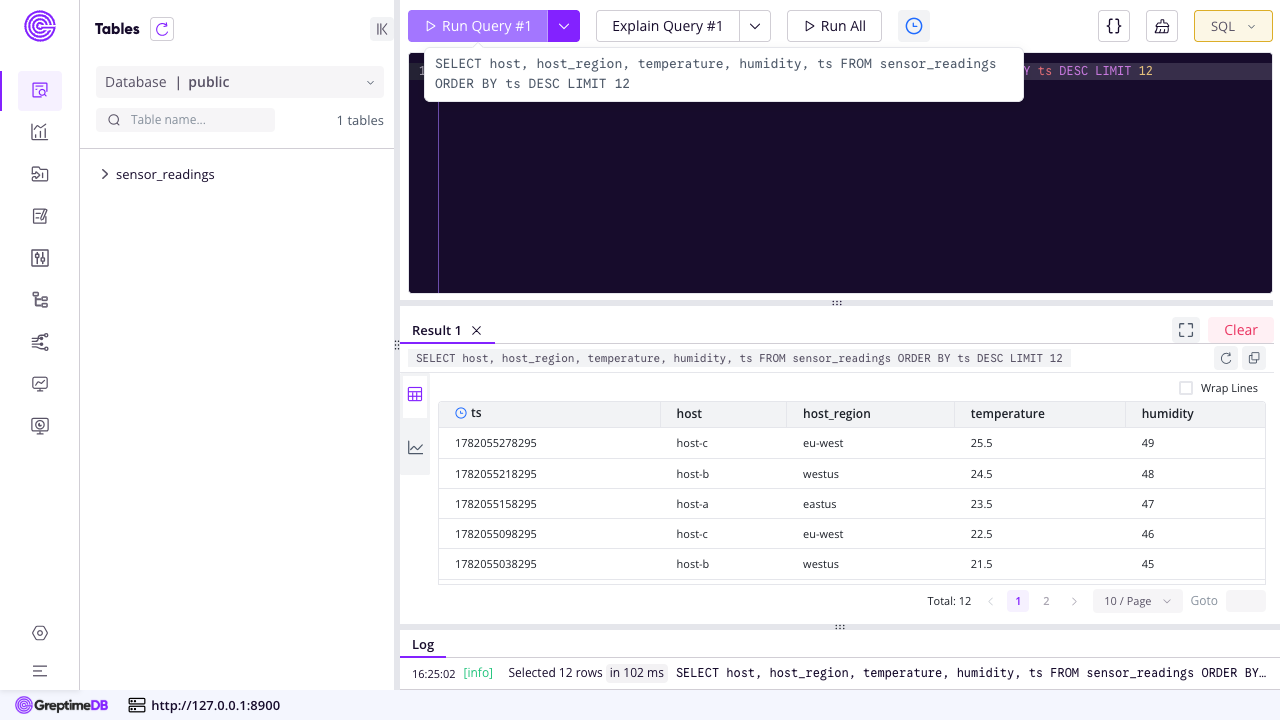
Browse to http://<vm-public-ip>/dashboard/ and sign in as admin with the password from Step 5. The Dashboard's Query view is a SQL/PromQL console: type a statement, click Run Query, and inspect the result as a table or a chart. The image ships an empty database ready for your data; the screenshots below show a sample sensor_readings table you can recreate from Step 9.
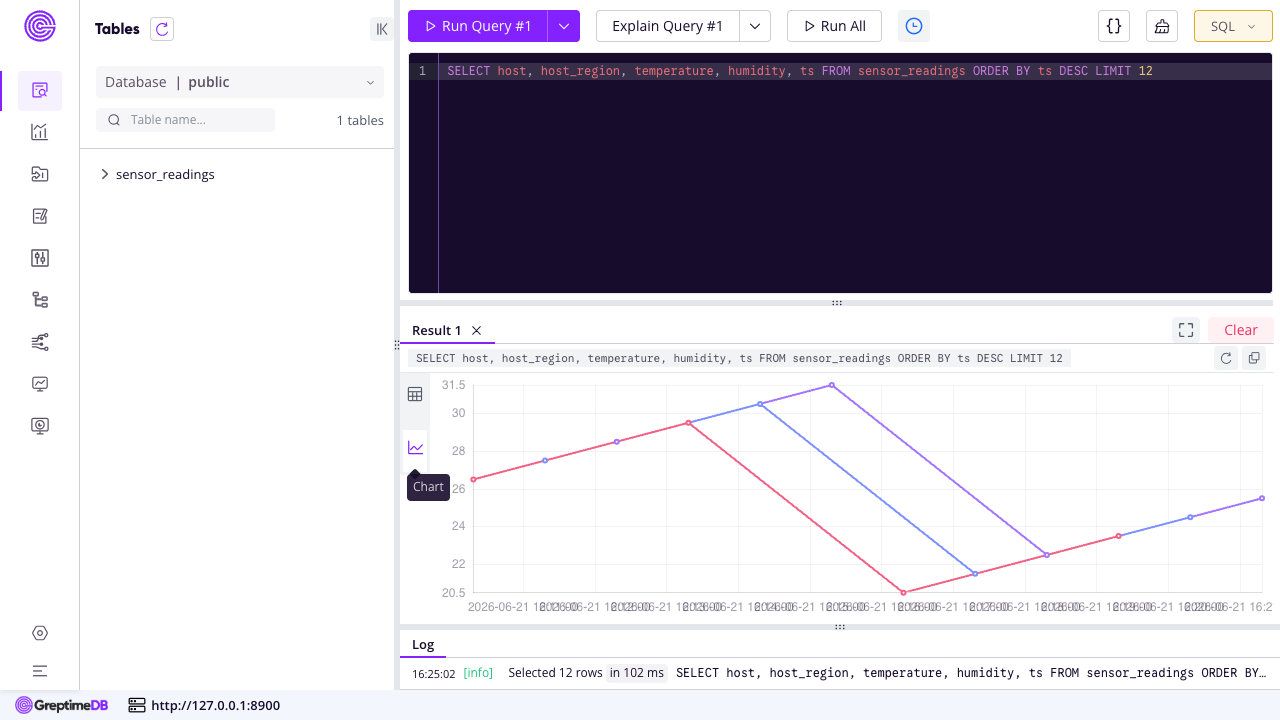
Switch the result panel to Chart to render the same query as a time-series line chart:
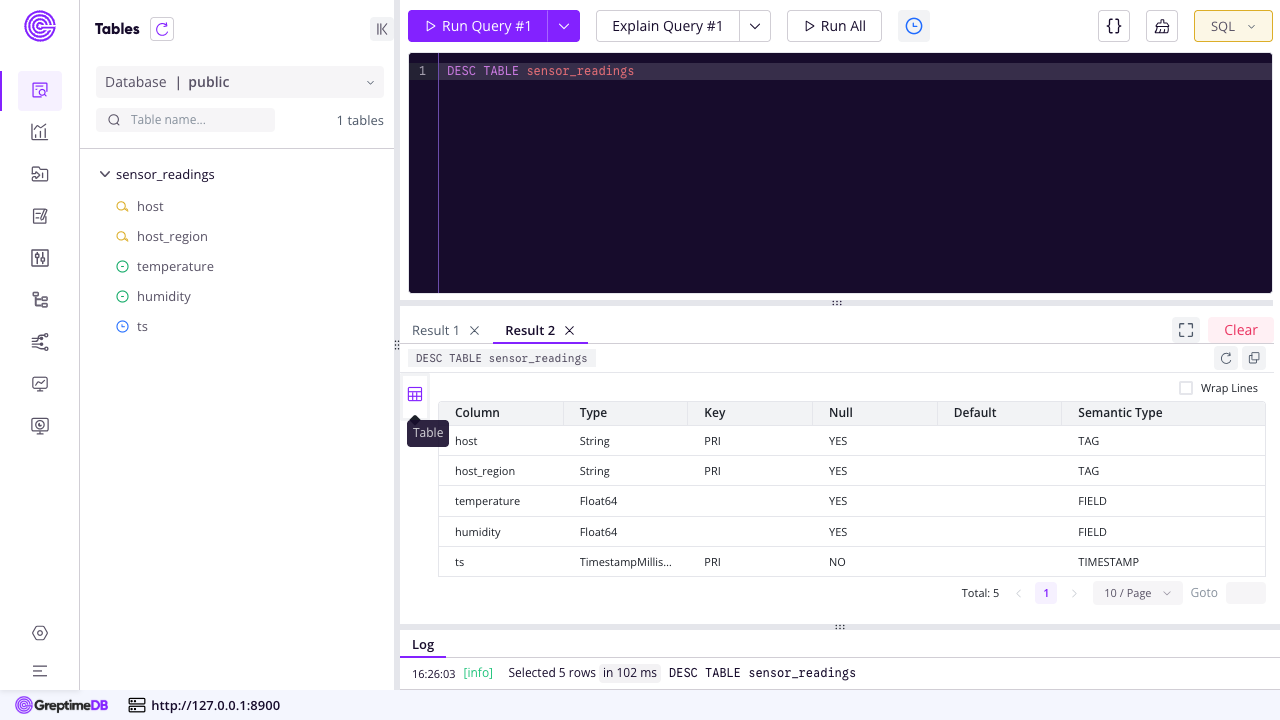
The left Tables browser expands each table to its columns, and DESC TABLE <name> returns the full schema including each column's semantic type (TAG, FIELD or TIMESTAMP):
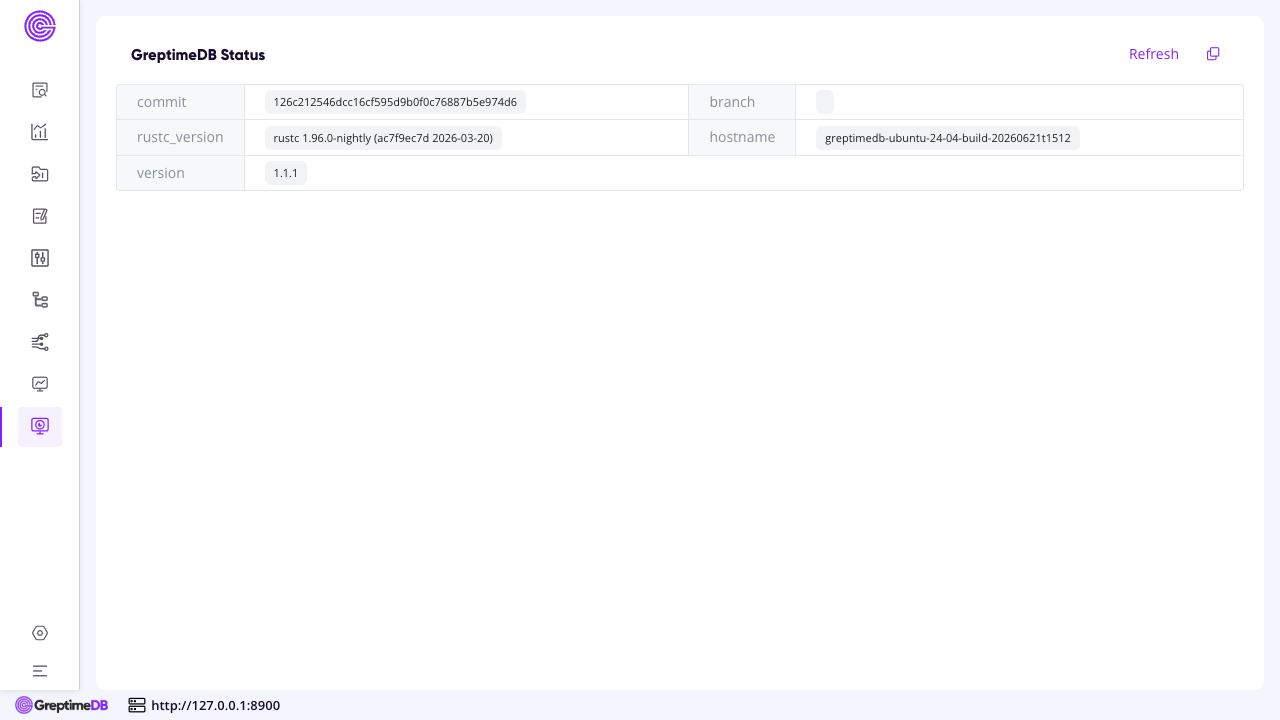
The Status page reports the running build, version and host:
Step 8 — Query from the command line
The SQL-over-HTTP API is available behind the same Basic auth. Confirm GreptimeDB is serving and report its version:
curl -s -u admin:<GREPTIMEDB_ADMIN_PASSWORD> -X POST http://localhost/v1/sql --data-urlencode 'sql=SELECT version()'; echo
You get a JSON response whose output[0].records.rows carries the running version (1.1.1). Every successful query returns an "output" array; errors return a "code" and "error" instead.
Step 9 — Create a table and query it
GreptimeDB tables need a TIMESTAMP TIME INDEX column. Create a small table, insert a row, and read it back over the SQL API (note that region is a reserved keyword, so the example uses host_region):
PW=<GREPTIMEDB_ADMIN_PASSWORD>
curl -s -u admin:$PW -X POST http://localhost/v1/sql --data-urlencode "sql=CREATE TABLE IF NOT EXISTS sensor_readings (host STRING, host_region STRING, temperature DOUBLE, humidity DOUBLE, ts TIMESTAMP TIME INDEX, PRIMARY KEY(host, host_region))"; echo
curl -s -u admin:$PW -X POST http://localhost/v1/sql --data-urlencode "sql=INSERT INTO sensor_readings (host, host_region, temperature, humidity, ts) VALUES ('host-a','eastus',23.5,47.0,now())"; echo
curl -s -u admin:$PW -X POST http://localhost/v1/sql --data-urlencode "sql=SELECT host, host_region, temperature, humidity, ts FROM sensor_readings ORDER BY ts DESC LIMIT 5"; echo
Each call returns a JSON "output" array. The same table appears in the Dashboard's Tables browser and Query console.
Step 10 — Ingest with the InfluxDB line protocol
GreptimeDB accepts the InfluxDB v2 write API, so existing Telegraf and InfluxDB clients can ship data unchanged. Write a point and query it back (the table is created automatically on first write):
PW=<GREPTIMEDB_ADMIN_PASSWORD>
curl -s -u admin:$PW -X POST 'http://localhost/v1/influxdb/api/v2/write?db=public' --data-binary 'weather,location=office temperature=21.3'
curl -s -u admin:$PW -X POST http://localhost/v1/sql --data-urlencode 'sql=SELECT * FROM weather'; echo
The write returns HTTP 204 and the point is immediately queryable. GreptimeDB also exposes PromQL at /v1/promql, the Prometheus remote-write endpoint, MySQL wire protocol on loopback 4002 and Postgres wire protocol on loopback 4003 — all reachable from the VM itself or tunnelled over SSH.
Step 11 — Confirm data lives on the dedicated disk
All time-series data is stored on the dedicated Azure data disk so it survives OS changes and can be resized independently:
findmnt /var/lib/greptimedb
The mount is backed by a separate Azure data disk captured into the image and re-provisioned on every VM.
Enabling HTTPS
The nginx reverse proxy terminates plain HTTP on port 80. For public exposure, put a certificate in front of it. The simplest path is to add a DNS name for the VM and use the companion cloudimg nginx-ssl-certbot image as a TLS reverse proxy, or install certbot and extend the existing nginx site with a listen 443 ssl; server block and your certificate paths. Keep GreptimeDB itself bound to loopback so the only public surface is the authenticated, TLS-terminated proxy.
Maintenance
- Configuration: the standalone listeners and
--data-homeare set in/etc/default/greptimedb(theGT_ARGSline). Edit it andsudo systemctl restart greptimedbto apply changes. - Backups: snapshot the
/var/lib/greptimedbdata disk, or use GreptimeDB's export tooling to copy data to Azure Blob Storage. - Upgrades: replace
/usr/local/bin/greptimewith a newer release and restart the service. - Security patches: unattended-upgrades remains enabled so the OS continues to receive security updates automatically.
Support
cloudimg provides 24/7 expert support for this image. Contact support@cloudimg.co.uk.
GreptimeDB is a trademark of Greptime Inc. This image is produced by cloudimg and is not affiliated with or endorsed by the GreptimeDB project. GreptimeDB is distributed under the Apache License 2.0.