Jaeger 1 Distributed Tracing on AWS User Guide
Jaeger 1 Distributed Tracing on AWS User Guide
This guide walks through the cloudimg Jaeger AMI from AWS Marketplace: SSH into your instance, retrieve the per-instance Jaeger UI password, send OpenTelemetry traces from your application, and explore them in the Jaeger Query UI.
The image runs the jaeger-all-in-one binary (Jaeger 1.x) as a systemd service, with
the embedded Badger key-value store persisting trace data to a dedicated EBS data
volume. The Jaeger Query UI is fronted by an nginx reverse proxy on port 80 with HTTP
basic authentication so the UI is never exposed without credentials.
What the image gives you
| Component | Detail |
|---|---|
| Jaeger | Jaeger 1.76 (jaeger-all-in-one) installed at /usr/local/bin/jaeger-all-in-one |
| Storage | Embedded Badger key-value store on a dedicated EBS data volume mounted at /var/lib/jaeger |
| Receivers | OTLP gRPC on :4317, OTLP HTTP on :4318, legacy Jaeger collector on :14268 |
| Query UI | nginx reverse proxy on :80 with HTTP basic auth, proxying to 127.0.0.1:16686 |
| First-boot credential | Per-instance UI password generated on first boot and stored in /root/jaeger-credentials.txt (mode 0600, root only) |
| Systemd units | jaeger.service, nginx.service, jaeger-firstboot.service (one-shot) |
Connecting to your instance
Use the SSH login user for your OS variant when connecting; the command examples below
use ubuntu because the current variant of this image is Ubuntu 24.04.
| OS variant | SSH user | Example command |
|---|---|---|
| Ubuntu 24.04 | ubuntu |
ssh -i your-key.pem ubuntu@<instance-public-ip> |
The cloudimg-recommended instance type is m5.large. The product's pricing covers
every current-generation x86_64 instance type with a 7-day free trial.
Security group
The launched AMI listens on these ports. Restrict each one to trusted networks in production:
| Port | Protocol | Purpose |
|---|---|---|
| 22 | TCP | SSH |
| 80 | TCP | Jaeger Query UI through nginx (HTTP basic auth enforced) |
| 4317 | TCP | OpenTelemetry Protocol — gRPC receiver |
| 4318 | TCP | OpenTelemetry Protocol — HTTP receiver |
The collector port 14268 and the Jaeger query gRPC port 16685 listen on localhost
only and are not exposed externally.
Step 1 — retrieve the per-instance Jaeger UI password
SSH into your instance and read the credentials file:
sudo cat /root/jaeger-credentials.txt
The file is generated on first boot and is unique to your instance. It looks like:
# Jaeger 1 — generated on first boot by jaeger-firstboot.service.
# This UI password is unique to this instance. Store it somewhere safe;
# it is shown in plain text only here.

jaeger.ui.url=http://<your-instance-ip>/
jaeger.ui.user=admin
jaeger.ui.pass=<JAEGER_UI_PASSWORD>

# OpenTelemetry endpoints (no authentication — restrict via security group):
jaeger.otlp.grpc=<your-instance-ip>:4317
jaeger.otlp.http=http://<your-instance-ip>:4318
jaeger.collector.legacy=http://<your-instance-ip>:14268/api/traces
Copy the password somewhere safe; it is shown in plain text only in this file. The
file is created with mode 0600 and is readable only by root.
Step 2 — sign in to the Jaeger Query UI
Browse to your instance address on port 80:
http://<your-instance-public-ip>/
You will be prompted for HTTP basic authentication. Sign in as admin with the
password you just retrieved.
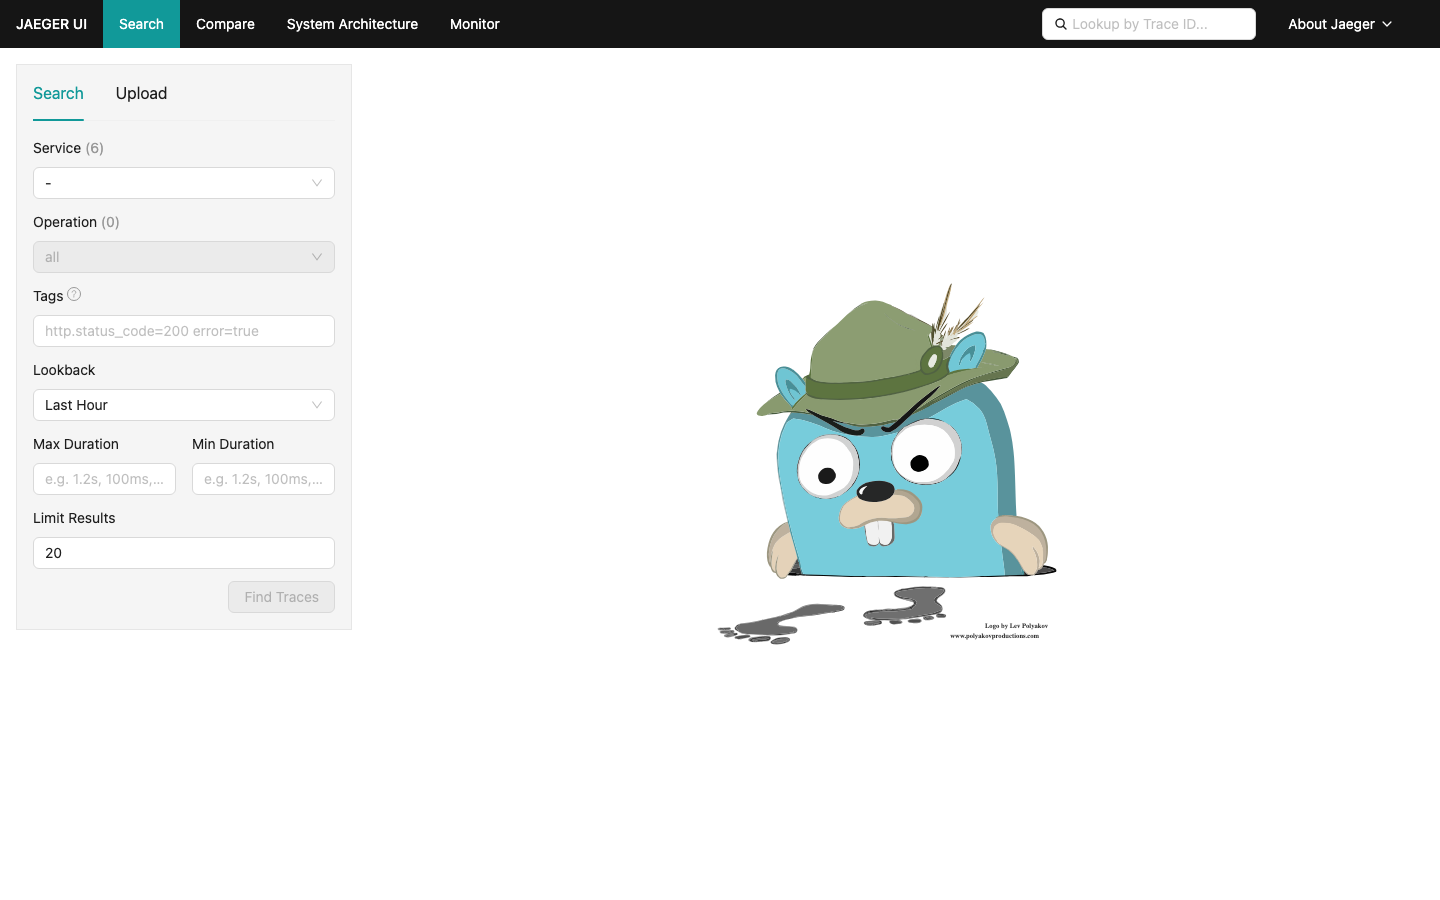
The search page lists every service that has reported a span to the back end, along with the operations seen on that service.
Step 3 — send some traces
For a first end-to-end check you can POST an OpenTelemetry span directly to the OTLP HTTP receiver. From the instance itself:
# Read the UI password into an env var (basic auth only protects the UI, not OTLP)
PASS=$(sudo grep '^jaeger.ui.pass=' /root/jaeger-credentials.txt | cut -d= -f2-)

# Push a synthetic span (use real OpenTelemetry SDKs in production)
NOW_NS=$(date +%s%N)
END_NS=$((NOW_NS + 1000000))
TRACE_ID=$(head -c 16 /dev/urandom | xxd -p -c 16)
SPAN_ID=$(head -c 8  /dev/urandom | xxd -p -c 8)

curl -fsS -X POST http://127.0.0.1:4318/v1/traces \
    -H 'Content-Type: application/json' \
    -d @- <<JSON
{
  "resourceSpans":[{
    "resource":{"attributes":[{"key":"service.name","value":{"stringValue":"my-first-service"}}]},
    "scopeSpans":[{"scope":{"name":"demo"},"spans":[
      {"traceId":"${TRACE_ID}","spanId":"${SPAN_ID}","name":"hello-world","kind":1,
       "startTimeUnixNano":"${NOW_NS}","endTimeUnixNano":"${END_NS}"}
    ]}]
  }]
}
JSON

# Confirm the service is visible (this hits nginx, so basic auth applies)
curl -fsS -u admin:"${PASS}" http://127.0.0.1/api/services
Output:
{"data":["my-first-service","jaeger-all-in-one"],"total":2,"limit":0,"offset":0,"errors":null}
In a real application use the OpenTelemetry SDK for your language and point it at the
OTLP endpoints (<instance-ip>:4317 for gRPC, http://<instance-ip>:4318 for HTTP).
Step 4 — explore traces in the Query UI
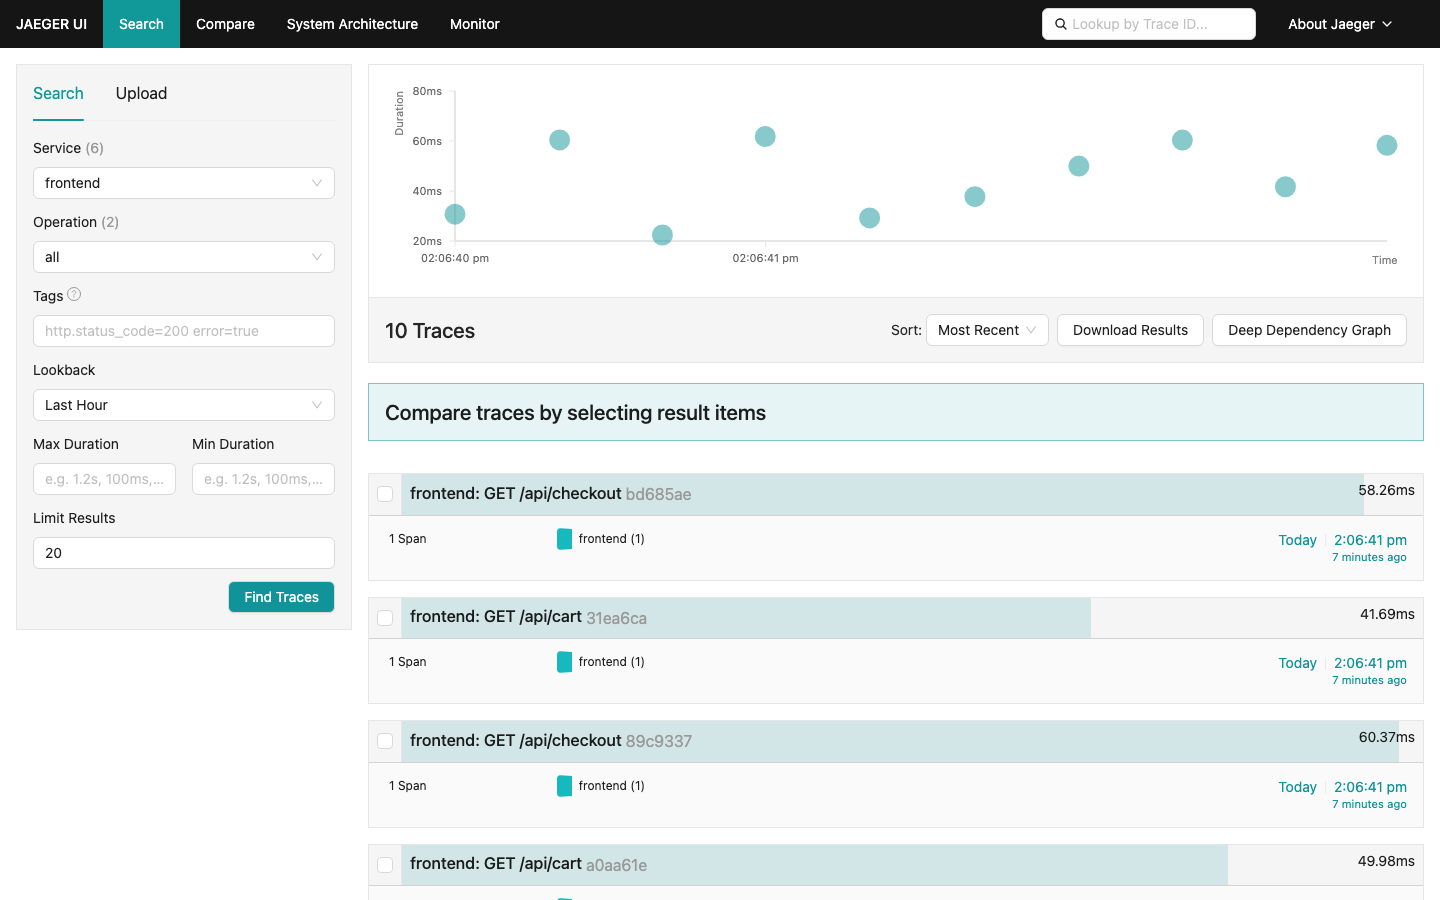
Refresh the search page. The service dropdown now lists your services; pick one, optionally narrow by operation and tags, and click Find Traces to see a scatter plot of trace durations and the underlying trace list.
Click a single trace from the list to see its full timeline — every span across every service that participated in the request, ordered by start time, with their durations visualised as bars.
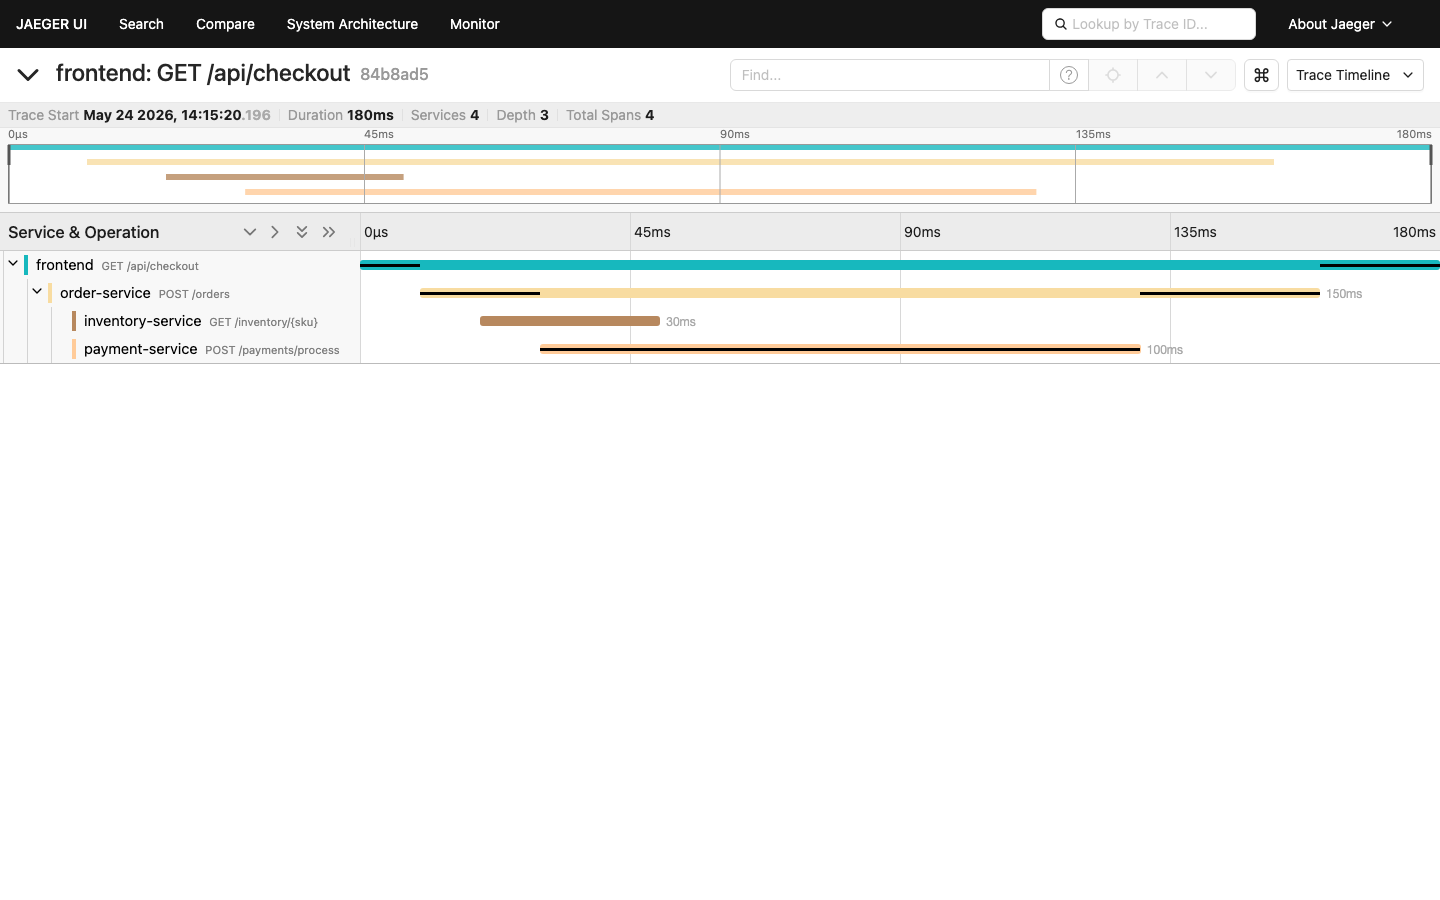
The trace timeline is the workhorse for distributed-tracing latency investigation: the critical path is the longest unbroken span chain, and any span much wider than its peers is the latency hotspot.
Step 5 — system architecture (dependencies graph)
Once your services are emitting spans with parent/child relationships across services, the System Architecture tab shows the inferred service dependency graph. Each arrow is annotated with the count of cross-service calls.
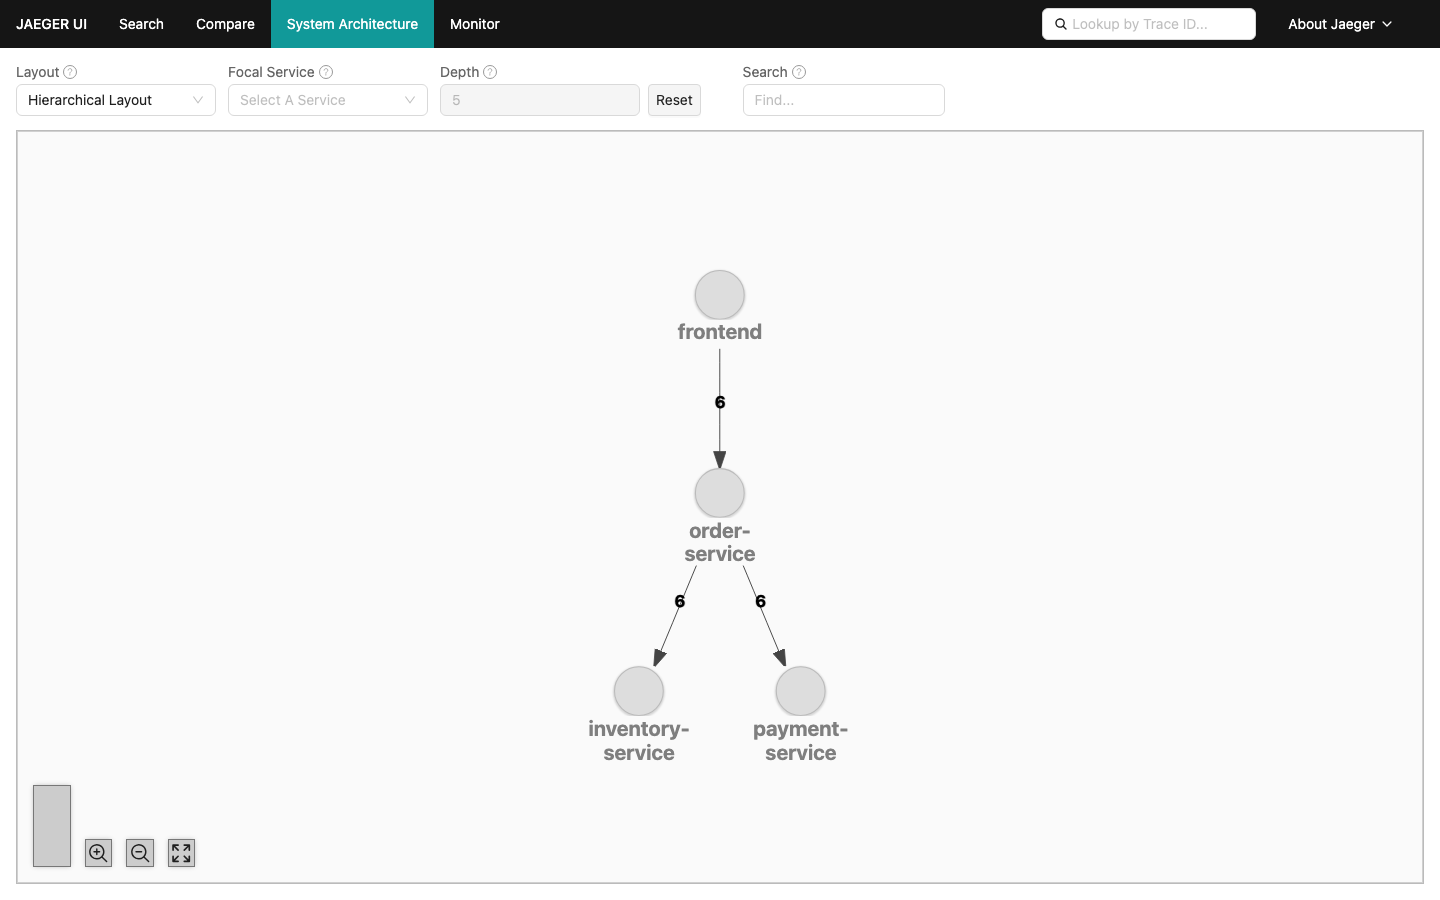
This is the fastest way to visualise the actual runtime call topology of a microservices deployment, including any unexpected calls that have crept in.
OpenTelemetry SDK quick reference
Point any OpenTelemetry SDK at your Jaeger instance with the OTLP exporter. Examples:
Python
pip install opentelemetry-sdk opentelemetry-exporter-otlp-proto-http
from opentelemetry import trace
from opentelemetry.sdk.resources import Resource
from opentelemetry.sdk.trace import TracerProvider
from opentelemetry.sdk.trace.export import BatchSpanProcessor
from opentelemetry.exporter.otlp.proto.http.trace_exporter import OTLPSpanExporter

resource = Resource.create({"service.name": "my-python-service"})
provider = TracerProvider(resource=resource)
provider.add_span_processor(
    BatchSpanProcessor(
        OTLPSpanExporter(endpoint="http://<instance-ip>:4318/v1/traces")
    )
)
trace.set_tracer_provider(provider)

tracer = trace.get_tracer("my-python-service")
with tracer.start_as_current_span("hello"):
    print("traced!")
Node.js
npm install @opentelemetry/sdk-node @opentelemetry/exporter-trace-otlp-http \
    @opentelemetry/auto-instrumentations-node @opentelemetry/resources \
    @opentelemetry/semantic-conventions
const { NodeSDK } = require('@opentelemetry/sdk-node');
const { OTLPTraceExporter } = require('@opentelemetry/exporter-trace-otlp-http');
const { resourceFromAttributes } = require('@opentelemetry/resources');
const { ATTR_SERVICE_NAME } = require('@opentelemetry/semantic-conventions');

const sdk = new NodeSDK({
  resource: resourceFromAttributes({
    [ATTR_SERVICE_NAME]: 'my-node-service',
  }),
  traceExporter: new OTLPTraceExporter({
    url: 'http://<instance-ip>:4318/v1/traces',
  }),
});
sdk.start();
Go
go get go.opentelemetry.io/otel \
       go.opentelemetry.io/otel/exporters/otlp/otlptrace/otlptracehttp \
       go.opentelemetry.io/otel/sdk
The same exporter pattern applies — point WithEndpoint("<instance-ip>:4318") at
your Jaeger instance and the SDK does the rest.
Day-to-day operations
Service status
sudo systemctl is-active jaeger.service nginx.service
sudo systemctl status jaeger.service --no-pager | head -10
The jaeger-firstboot.service is a one-shot that runs only on the first boot;
once the sentinel file /var/lib/cloudimg/jaeger-firstboot.done exists, the service
shows as inactive — that is the expected state on a customer instance after the
first boot has completed.
Logs
# Jaeger collector + query
sudo journalctl -u jaeger.service -f

# nginx reverse proxy
sudo journalctl -u nginx.service -f
sudo tail -f /var/log/nginx/access.log /var/log/nginx/error.log
Storage
Trace data lives under /var/lib/jaeger on the dedicated EBS data volume:
df -h /var/lib/jaeger
sudo du -sh /var/lib/jaeger/keys /var/lib/jaeger/values
The volume is gp3 and resizable from the AWS console with no Jaeger restart needed
beyond sudo resize2fs /dev/nvme1n1 after the EBS expansion completes.
Rotating the UI password
NEW_PASS="$(head -c 32 /dev/urandom | base64 | tr -d '/+=' | head -c 24)"
sudo htpasswd -bB /etc/nginx/.htpasswd admin "${NEW_PASS}"
sudo systemctl reload nginx
sudo sed -i "s|^jaeger.ui.pass=.*|jaeger.ui.pass=${NEW_PASS}|" /root/jaeger-credentials.txt
Adding a second user
sudo htpasswd -B /etc/nginx/.htpasswd alice
sudo systemctl reload nginx
Enabling HTTPS
Out of the box the UI is HTTP only; for production deployments terminate TLS in front of nginx. Two common options:
- Let's Encrypt + Certbot — install
certbotand the nginx plugin (sudo apt-get install certbot python3-certbot-nginx), point a DNS name at the instance, thensudo certbot --nginx -d your-domainand certbot will rewrite the nginx config to serve HTTPS on:443with auto-renewal. - AWS Application Load Balancer in front — terminate TLS on the ALB with an ACM
certificate, target group health check
/healthzon:80(which is unauthenticated in this image for exactly this purpose), and forward to the instance on port 80.
Production hardening checklist
- Restrict
:80,:4317and:4318to your application VPC / known IP ranges. - Rotate the UI password (see above) after any operator change.
- Place an ALB in front and terminate TLS there, or run Certbot for a per-instance certificate.
- Resize the
/var/lib/jaegerEBS volume from gp3 30 GiB to whatever your retention needs require; Badger is a single-binary key-value store so trace volume scales with disk size. - For long-term retention, switch the storage back end from Badger to Elasticsearch or
OpenSearch by setting
SPAN_STORAGE_TYPE=elasticsearchin/etc/jaeger/jaeger.envand pointing the relevantES_*environment variables at your cluster; restartjaeger.service.
Troubleshooting
| Symptom | Likely cause |
|---|---|
| Browser returns 401 unauthorised | nginx basic auth — use admin and the password from /root/jaeger-credentials.txt |
| Browser returns 502 Bad Gateway | jaeger.service is not running — sudo systemctl start jaeger.service |
/api/services returns {"data":null} |
No spans have arrived yet — push a test span (Step 3) |
Service appears but Find Traces returns nothing |
Adjust the Lookback in the search panel — traces older than 1 hour are hidden by default |
jaeger-firstboot.service failed |
Inspect journalctl -u jaeger-firstboot.service — typically the EBS data volume failed to mount |
Useful links
- Jaeger documentation — https://www.jaegertracing.io/docs/
- OpenTelemetry instrumentation guides — https://opentelemetry.io/docs/languages/
- Jaeger on GitHub — https://github.com/jaegertracing/jaeger
- Cloud Native Computing Foundation — https://www.cncf.io/projects/jaeger/
For cloudimg support, email support@cloudimg.co.uk with your AWS account, region and the instance id.
Screenshots

The Jaeger Query UI search page, fronted by nginx HTTP basic authentication and served on first boot with no manual setup.

Choosing a service to inspect from the Jaeger Query UI service dropdown.

The Jaeger trace timeline showing the spans that make up a single distributed request.