Grafana Loki 3 on Ubuntu 24.04 on Azure User Guide
Overview
Grafana Loki is the log-aggregation system from the Grafana Labs ecosystem — index-only-on-labels (no full-text index), horizontally scalable, designed to be cheap to operate and easy to integrate with Promtail, Fluent Bit, OpenTelemetry, and Grafana's "Explore" view. The cloudimg image installs Loki 3.7 (single Go binary, ~60 MB resident) configured for single-tenant filesystem storage — ready to ingest logs from day one and to scale up to S3/GCS/Azure Blob as your traffic grows.
What is included:
- Loki 3.7.x single Go binary at
/usr/local/bin/loki(from the officialgrafana/lokiGitHub release) - Single-tenant filesystem store at
/var/lib/loki/(chunks + rules + WAL) - HTTP API on TCP 3100 —
/loki/api/v1/push,/loki/api/v1/query,/loki/api/v1/query_range,/metrics,/ready - gRPC API on TCP 9096 (cluster, internal)
loki.servicerunning asloki:lokisystem user- Prometheus-format
/metricsendpoint for scraping - 24/7 cloudimg support
Prerequisites
Active Azure subscription, SSH key, VNet + subnet. Standard_B2s (4 GB RAM) is sufficient for moderate single-tenant workloads (a few thousand log lines per second). For high-volume production, scale up to D4s/D8s and switch the storage backend from filesystem to Azure Blob (storage_config.azure).
Step 1-3: Deploy + SSH (standard pattern)
ssh azureuser@<vm-ip>
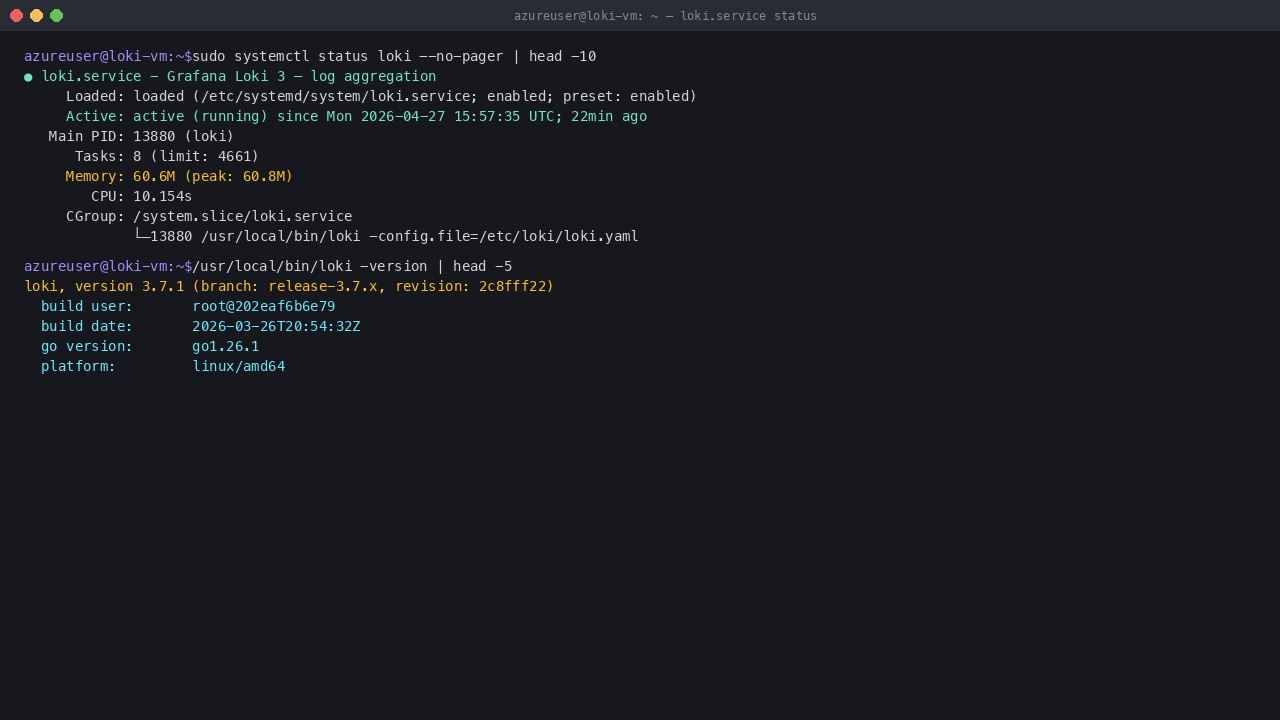
Step 4: Verify Service + Version
sudo systemctl status loki --no-pager | head -10
/usr/local/bin/loki -version | head -5
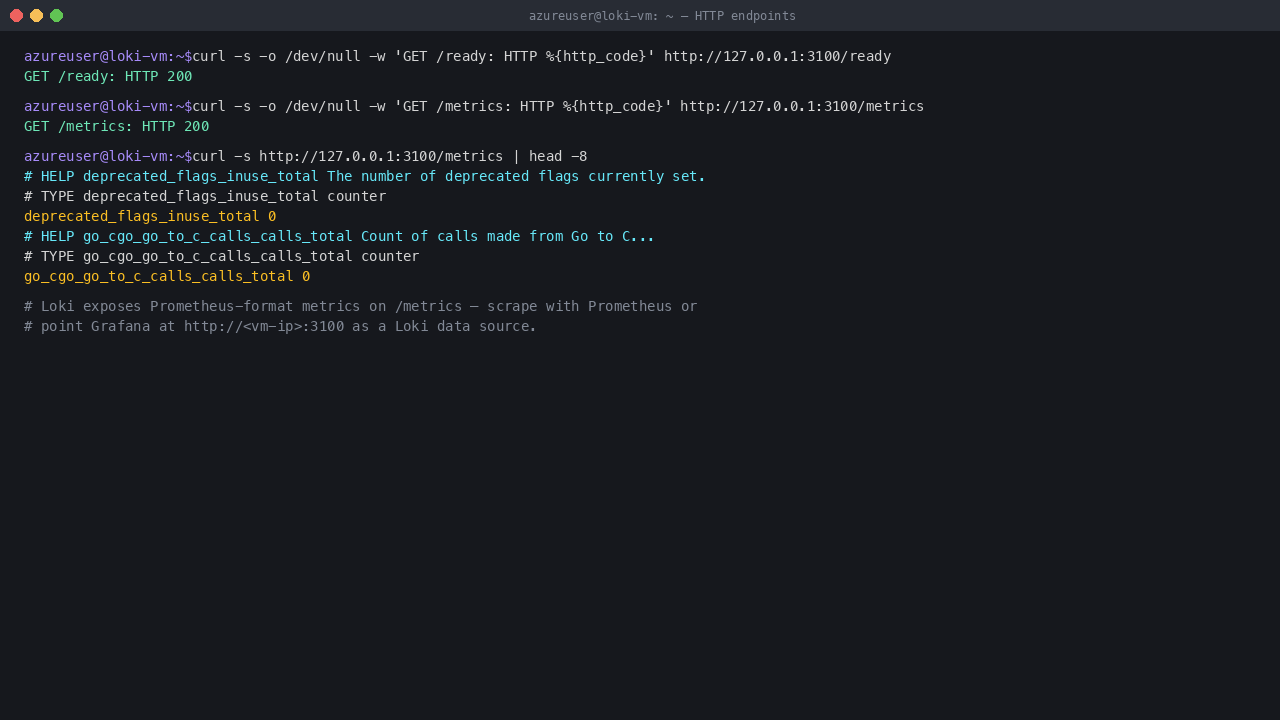
Step 5: HTTP Endpoints
curl -s -o /dev/null -w 'GET /ready: HTTP %{http_code}\n' http://127.0.0.1:3100/ready
curl -s -o /dev/null -w 'GET /metrics: HTTP %{http_code}\n' http://127.0.0.1:3100/metrics
Step 6: Read Customer Endpoints
sudo cat /stage/scripts/loki-credentials.log
The credentials file contains the per-VM URLs (push / query / metrics / ready) populated with the VM's reachable IP at first boot.
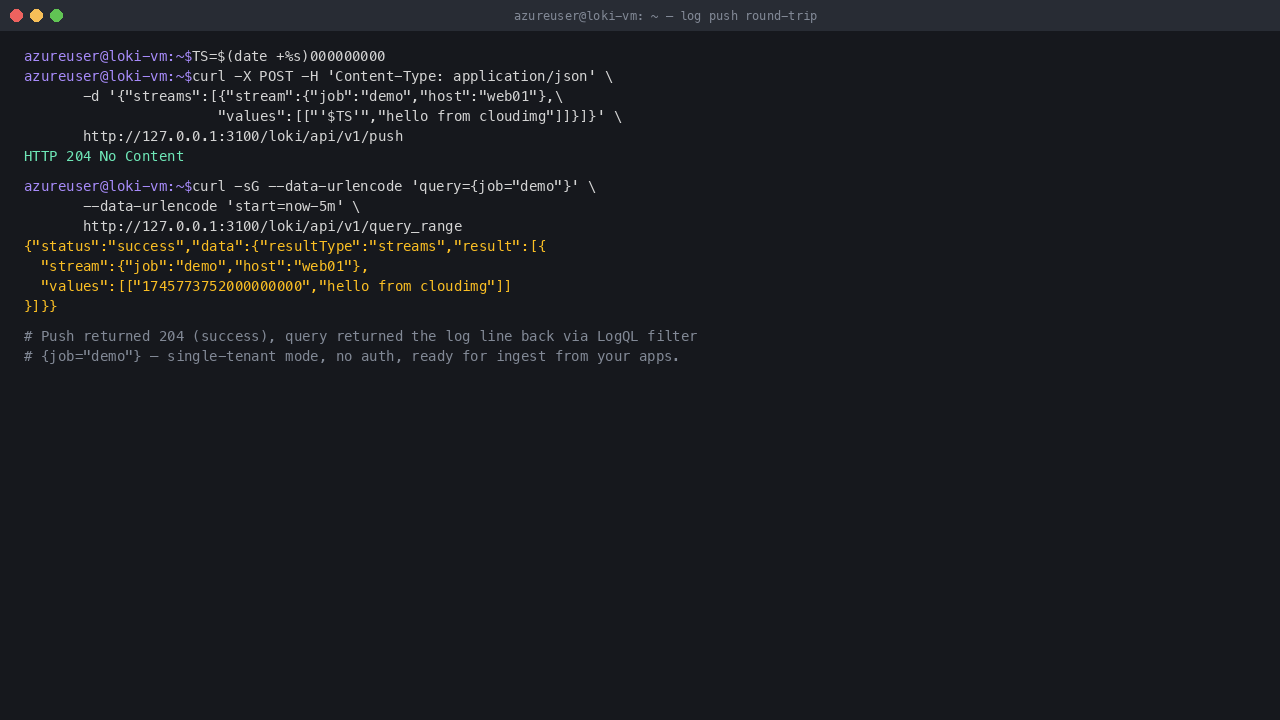
Step 7: Push + Query Round-Trip
TS=$(date +%s)000000000
curl -X POST -H 'Content-Type: application/json' \
     -d "{\"streams\":[{\"stream\":{\"job\":\"demo\",\"host\":\"web01\"},\"values\":[[\"${TS}\",\"hello from cloudimg\"]]}]}" \
     http://127.0.0.1:3100/loki/api/v1/push
sleep 2
curl -sG --data-urlencode 'query={job="demo"}' \
     --data-urlencode "start=$(($(date +%s) - 300))000000000" \
     --data-urlencode "end=$(date +%s)000000000" \
     http://127.0.0.1:3100/loki/api/v1/query_range | head -c 200
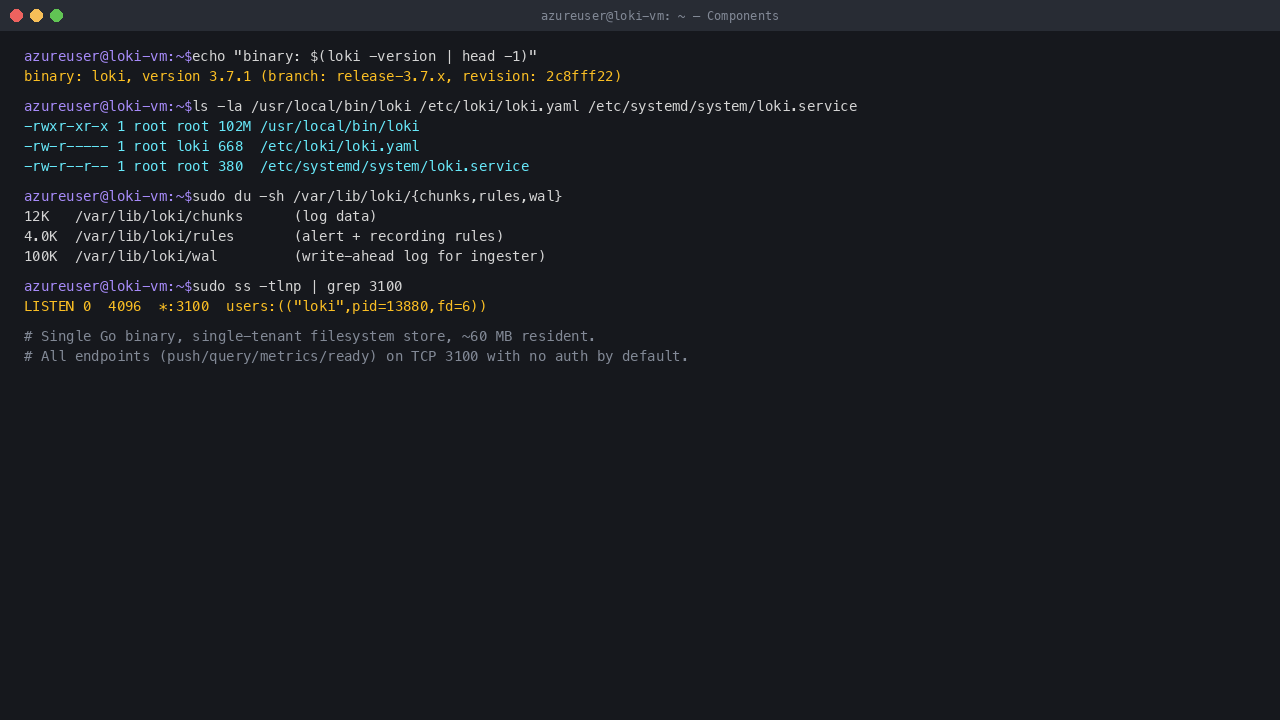
Step 8: Components
| Component | Path |
|---|---|
| Loki binary | /usr/local/bin/loki |
| Config | /etc/loki/loki.yaml |
| Data dir | /var/lib/loki/ (chunks, rules, wal) |
| systemd unit | /etc/systemd/system/loki.service |
| Run-as user | loki:loki |
| HTTP port | 3100 |
| gRPC port | 9096 (internal cluster comms) |
| Credentials | /stage/scripts/loki-credentials.log |
Step 9: Send Logs from Your Applications
Loki accepts logs via HTTP from any Loki-compatible client:
- Promtail (Grafana's official agent): scrapes files / journal / syslog and ships to Loki
- Fluent Bit / Fluentd: native
lokioutput plugin - OpenTelemetry Collector:
lokiexporter - Direct curl / SDK: any language can
POST /loki/api/v1/pushwith the JSON shape shown in Step 7
Point your client at http://<vm-ip>:3100/loki/api/v1/push (no auth by default — see Step 10 to add auth).
Step 10: View Logs in Grafana
In your Grafana instance:
- Configuration → Data sources → Add data source → Loki
- URL:
http://<vm-ip>:3100 - Save & test (should report "Data source connected and labels found")
- Open Explore → select Loki → use LogQL queries like
{job="demo"},{host="web01"} |= "error",rate({job="demo"}[1m])
Step 11: Production Hardening
- Add auth: place Loki behind nginx / apache / haproxy with HTTP basic auth or TLS client certs. Loki itself ships with
auth_enabled: false(single-tenant) for simplicity. - Switch storage to Azure Blob: edit
/etc/loki/loki.yamlstorage_config.azureblock, point at a Blob container, restartloki.service. - Retention: default retention is unlimited. Set
limits_config.retention_period: 720h(30 days) and enable the compactor incompactor:block of the config to enforce it. - Patch monthly:
apt-get update && apt-get upgrade && reboot. Watch the GitHub releases at https://github.com/grafana/loki/releases and re-deploy/usr/local/bin/lokiwith the new binary. - Restrict NSG so port 3100 is only reachable from your log-shipping clients and Grafana, not the public internet.
Licensing
Loki is AGPL-3.0 — free to use commercially. The cloudimg distribution adds packaging, hardening, and 24/7 support. cloudimg provides commercial support separately. support@cloudimg.co.uk.