OpenTelemetry Collector on Ubuntu 24.04 on Azure User Guide
Overview
The OpenTelemetry Collector is the vendor-neutral way to receive, process and export telemetry - metrics, logs and traces - from a single agent. It is part of the OpenTelemetry project, a Cloud Native Computing Foundation (CNCF) incubating project and the de-facto standard for application observability. The cloudimg image installs the official otelcol-contrib distribution (the contrib build, with the broadest set of receivers and exporters) as /usr/bin/otelcol-contrib, ships a clear ready-to-run sample pipeline, and enables the health_check and zPages extensions so you can confirm health and inspect the running pipeline from the moment the VM boots. Backed by 24/7 cloudimg support.
What is included:
- The OpenTelemetry Collector (
otelcol-contrib, Apache-2.0) from the official OpenTelemetry releases - The package
otelcol-contrib.servicesystemd unit, enabled and running on boot - A sample pipeline at
/etc/otelcol-contrib/config.yaml: ahostmetricsreceiver (cpu/memory/disk/filesystem/load every 10s) and anotlpreceiver (gRPC127.0.0.1:4317, HTTP127.0.0.1:4318) for local apps to push to, withmemory_limiter,resourcedetectionandbatchprocessors, fanning out to adebugexporter and aprometheusexporter on127.0.0.1:8889 - The
health_checkextension on127.0.0.1:13133and thezPagesextension on127.0.0.1:55679 - 24/7 cloudimg support
This is a headless service product: every endpoint binds to 127.0.0.1 only, so no inbound application port is needed beyond SSH.
Prerequisites
An active Azure subscription, an SSH key pair, and a VNet + subnet in the target region. Standard_B2s (2 vCPU / 4 GiB RAM) is a good starting point. NSG inbound: allow 22/tcp from your management network. No inbound application ports are required.
Step 1 - Deploy from the Azure Marketplace
Sign in to the Azure Portal, choose Create a resource, search the Marketplace for OpenTelemetry Collector by cloudimg, and select Create. On Basics pick your subscription, resource group, region and size; under Administrator account choose SSH public key and paste your key; under Inbound port rules allow SSH (22). Then Review + create -> Create.
Step 2 - Deploy from the Azure CLI
az vm create \
  --resource-group <your-rg> \
  --name otelcol \
  --image <marketplace-image-urn> \
  --size Standard_B2s \
  --admin-username azureuser \
  --ssh-key-values ~/.ssh/id_ed25519.pub \
  --vnet-name <your-vnet> --subnet <your-subnet> \
  --public-ip-sku Standard
Step 3 - Connect to your VM
ssh azureuser@<vm-public-ip>
Step 4 - Confirm the Collector is installed and running
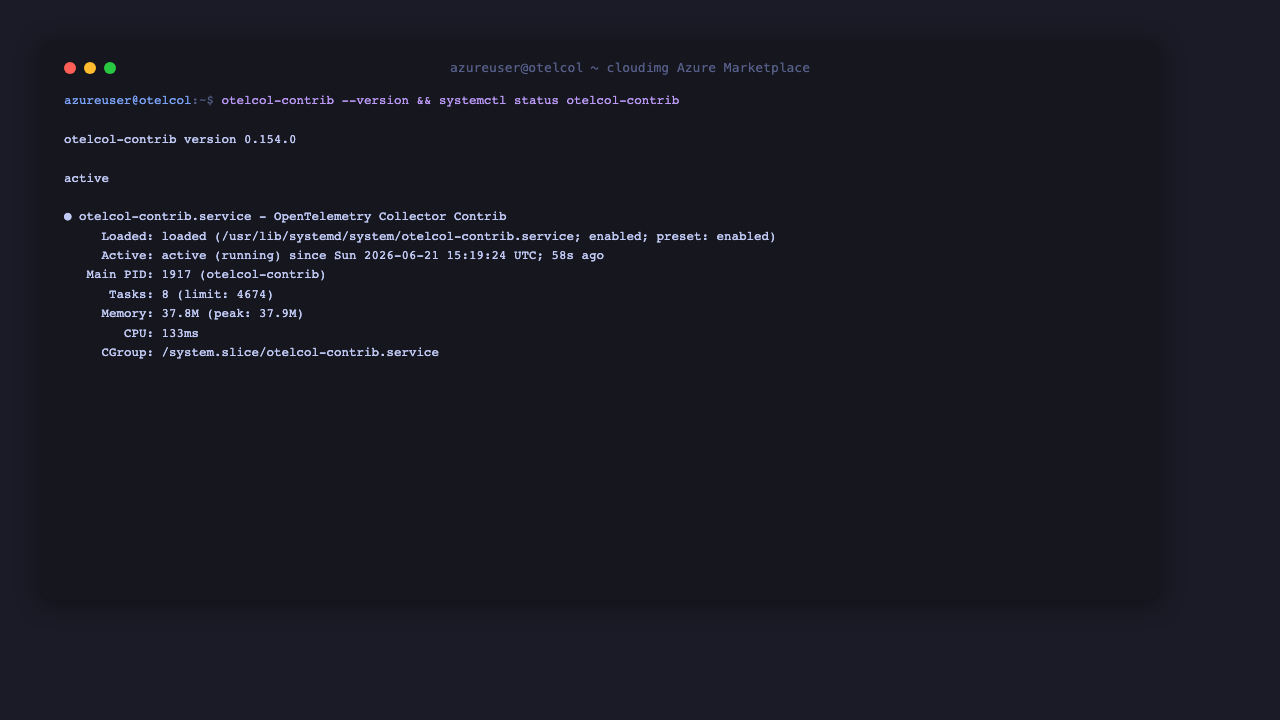
Check the version and that the service is active:
otelcol-contrib --version
systemctl is-active otelcol-contrib
otelcol-contrib --version reports otelcol-contrib version 0.154.0, and systemctl is-active otelcol-contrib prints active.
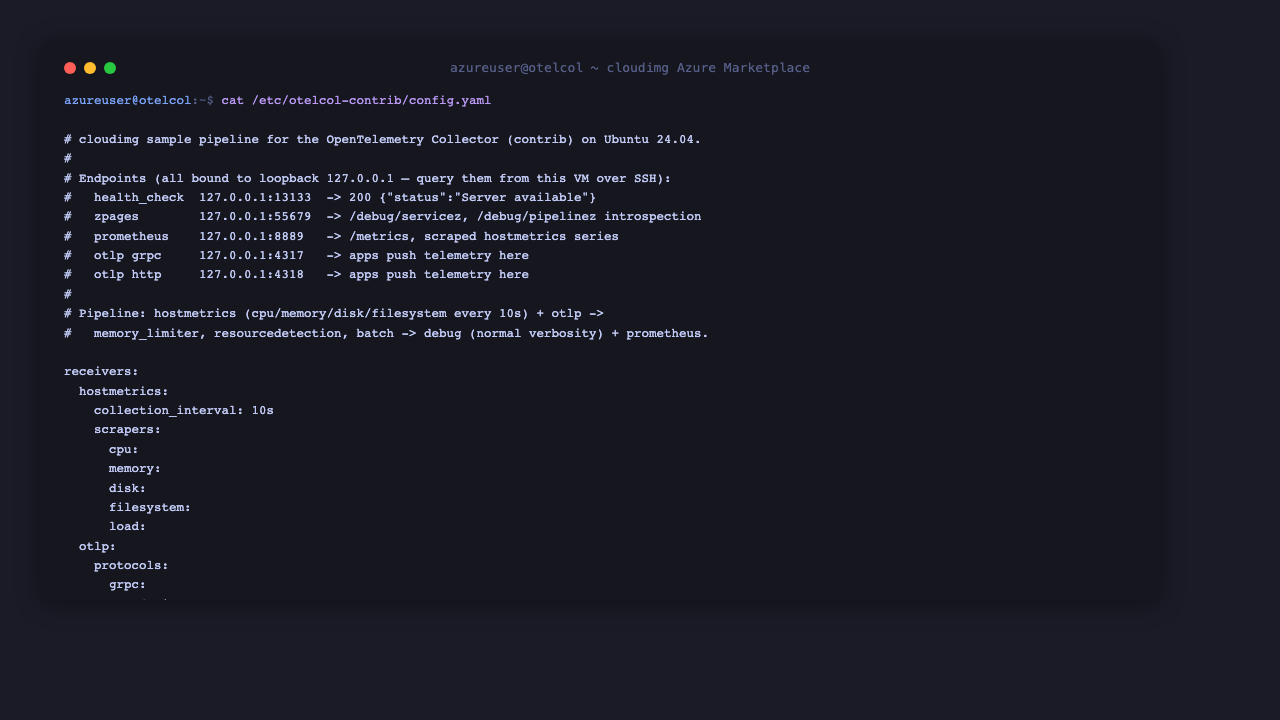
Step 5 - Review the sample pipeline
The ready-to-run pipeline lives at /etc/otelcol-contrib/config.yaml. It scrapes host metrics every 10 seconds, accepts OTLP pushes from local applications on loopback, applies the memory_limiter, resourcedetection and batch processors, and exports to both the debug logger and the Prometheus exporter:
cat /etc/otelcol-contrib/config.yaml
Step 6 - Check the Collector health
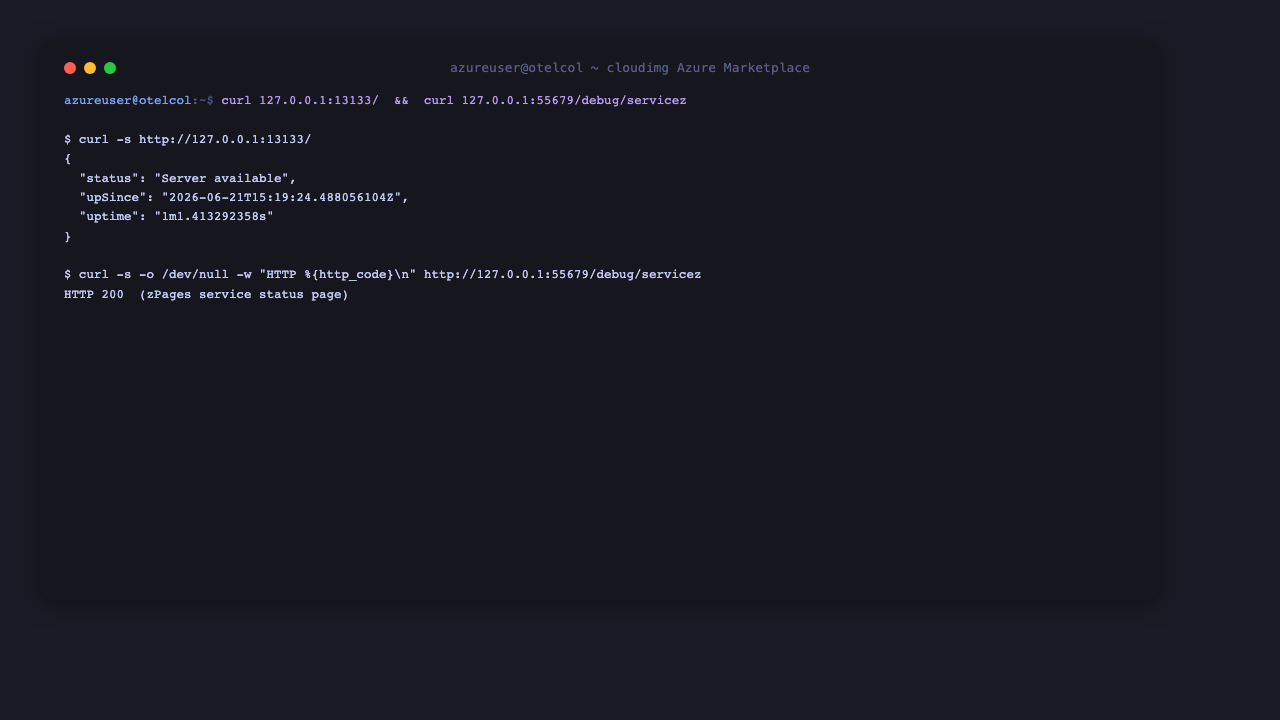
The health_check extension exposes a liveness endpoint that returns 200 with a JSON body of {"status":"Server available"} when the Collector is healthy:
curl -s http://127.0.0.1:13133/
It prints {"status":"Server available",...}.
Step 7 - Inspect the running pipeline with zPages
The zPages extension serves live, in-process diagnostics. The service page lists every active pipeline, receiver, processor and exporter:
curl -s -o /dev/null -w "%{http_code}\n" http://127.0.0.1:55679/debug/servicez
It returns 200. Open http://127.0.0.1:55679/debug/servicez (and /debug/pipelinez, /debug/tracez) over an SSH tunnel to browse the pages in detail.
Step 8 - Watch live host metrics through the Prometheus exporter
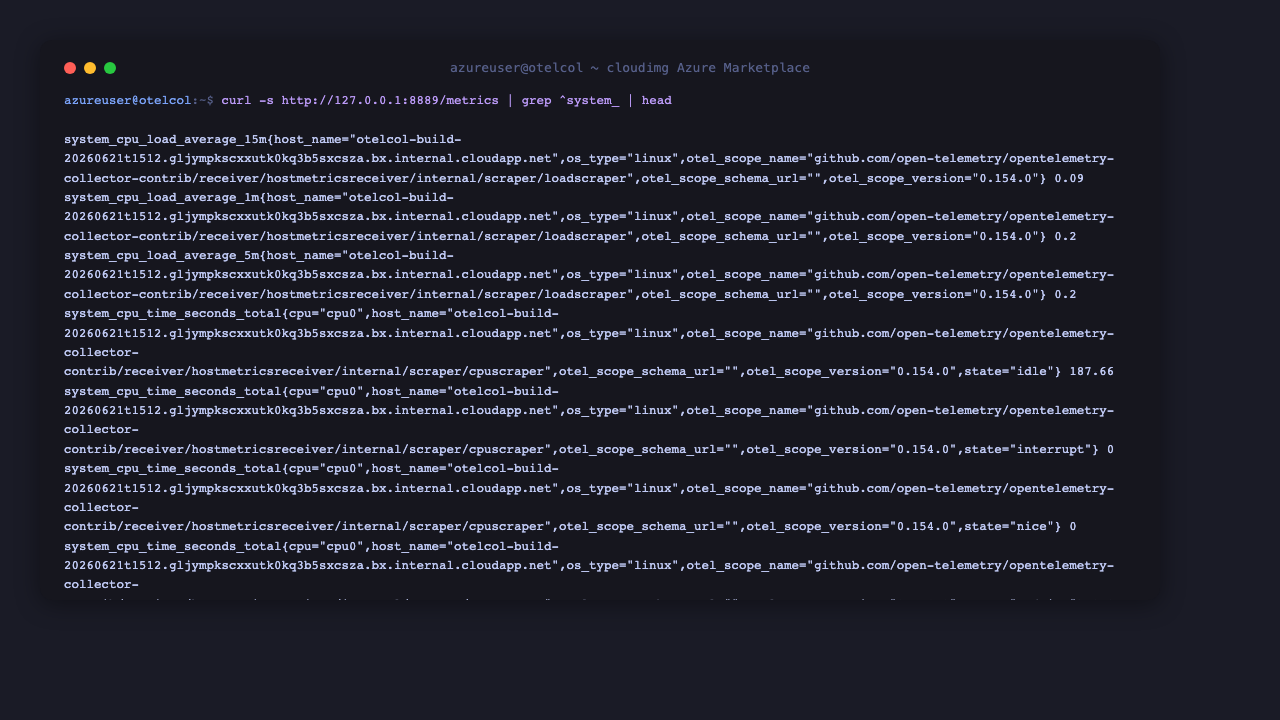
The prometheus exporter publishes every scraped series on 127.0.0.1:8889/metrics in the Prometheus text format. The hostmetrics receiver emits system_* series for CPU, memory, disk and filesystem usage:
curl -s http://127.0.0.1:8889/metrics | grep -E '^system_' | head -n 12 || true
You will see system_cpu_time, system_memory_usage, system_disk_io and related series, each labelled and carrying a live value.
Step 9 - Push your own telemetry over OTLP
The sample pipeline accepts OTLP on loopback - gRPC 127.0.0.1:4317 and HTTP 127.0.0.1:4318 - so an application or SDK running on the same VM can send metrics, logs and traces straight into the Collector with no extra wiring. Point your OpenTelemetry SDK exporter at one of:
# OTLP/gRPC
OTEL_EXPORTER_OTLP_ENDPOINT=http://127.0.0.1:4317

# OTLP/HTTP
OTEL_EXPORTER_OTLP_ENDPOINT=http://127.0.0.1:4318
Anything you push appears in the debug exporter's journald output and (for metrics) on the Prometheus exporter.
Step 10 - Customise the pipeline
Edit /etc/otelcol-contrib/config.yaml to add your own receivers, processors and exporters, then restart the service. The contrib distribution ships hundreds of components. A few common building blocks:
# Scrape Prometheus targets
receivers:
  prometheus:
    config:
      scrape_configs:
        - job_name: my-app
          static_configs:
            - targets: [localhost:9100]

# Export to an OTLP backend (Grafana, Honeycomb, Datadog, Jaeger, Tempo, ...)
exporters:
  otlphttp:
    endpoint: https://otlp.my-backend.example:4318

# Add the exporter to a pipeline under service.pipelines.metrics.exporters
After editing, validate the config and apply your changes:
otelcol-contrib validate --config /etc/otelcol-contrib/config.yaml
sudo systemctl restart otelcol-contrib
See the OpenTelemetry Collector documentation for the full component catalogue.
Maintenance
- Service: managed by systemd -
systemctl status otelcol-contrib,journalctl -u otelcol-contrib. - Configuration:
/etc/otelcol-contrib/config.yaml; restart the service after edits. Validate first withotelcol-contrib validate --config .... - Health and introspection:
health_checkon127.0.0.1:13133,zPageson127.0.0.1:55679, the Prometheus exporter on127.0.0.1:8889/metrics. - Upgrades: to upgrade, download the newer
otelcol-contrib.debfrom the OpenTelemetry releases and install it withsudo dpkg -i. - Security patches: unattended-upgrades remains enabled so the OS continues to receive security updates automatically.
Support
cloudimg provides 24/7 expert support for this image. Contact support@cloudimg.co.uk.
OpenTelemetry and the OpenTelemetry Collector are trademarks of the OpenTelemetry project, a project of the Cloud Native Computing Foundation. cloudimg is not affiliated with or endorsed by the OpenTelemetry project or the CNCF.