Prometheus 3 on Ubuntu 24.04 on Azure User Guide
Overview
This guide covers the deployment and configuration of Prometheus 3 on Ubuntu 24.04 on Azure using cloudimg Azure Marketplace images. Prometheus is the de facto open-source time-series metrics server in production observability stacks. The 3.x line ships major improvements in PromQL evaluation, native histograms, OTLP metrics ingestion, and remote-write reliability over the 2.x series.
The image ships the latest non-prerelease 3.x release of Prometheus, resolved at build time from the official github.com/prometheus/prometheus/releases API. The binary lives at /usr/local/bin/prometheus, the config at /etc/prometheus/prometheus.yml, and the TSDB at /var/lib/prometheus/data (NOT /mnt — Azure mounts the ephemeral resource disk at /mnt and that location does not survive SIG capture). The default config monitors Prometheus itself; example node-exporter and Grafana scrape jobs are commented in for customers to uncomment and edit.
Prometheus has no built-in authentication. This is by upstream design — auth and TLS are concerns for an external reverse proxy. For any non-loopback exposure, terminate TLS + basic auth (or AAD) at Nginx, Caddy, Apache, or an Azure Application Gateway. The cloudimg nginx-ssl-certbot-ubuntu-24-04 image is purpose-built as a companion reverse proxy.
What is included:
-
Prometheus 3 server installed from the official
github.com/prometheus/prometheus/releasestarball (latest 3.x at build time) -
promtoolat/usr/local/bin/promtoolfor config validation, rule testing, and tsdb administration -
Console templates and console libraries at
/etc/prometheus/consoles/and/etc/prometheus/console_libraries/ -
prometheus.servicesystemd unit auto-starting on boot, running as theprometheussystem user -
prometheus-firstboot.servicesystemd oneshot that writes endpoint info to/stage/scripts/prometheus-credentials.log -
Default scrape config at
/etc/prometheus/prometheus.ymlwith theprometheusjob pre-seeded; examplenodeandgrafanajobs commented in -
TSDB at
/var/lib/prometheus/data -
Listener on TCP 9090 (HTTP, no built-in auth)
-
Lifecycle API enabled (
--web.enable-lifecycle) socurl -X POST http://localhost:9090/-/reloadreloads config without restart -
Ubuntu 24.04 LTS base with latest security patches applied at build time
-
Azure Linux Agent for seamless cloud integration and SSH key injection
-
24/7 cloudimg support with guaranteed 24 hour response SLA
Prerequisites
-
An active Azure subscription
-
A subscription to the Prometheus 3 on Ubuntu 24.04 listing on Azure Marketplace
-
An SSH public key for VM authentication
-
A virtual network and subnet in the target region
Recommended virtual machine size: Standard_B2s (2 vCPU, 4 GB RAM) for development and small fleets. Production deployments scraping more than ~50 targets at 15s intervals should use Standard_D2s_v3 or larger with attached Premium SSD data disks for the TSDB.
Step 1: Deploy from the Azure Portal
Navigate to Marketplace in the Azure Portal, search for Prometheus 3, select the cloudimg publisher entry, and click Create.
On the Networking tab attach a network security group that allows inbound TCP 22 from your management IP range and TCP 9090 from your scrape clients (Grafana VM private IP, etc.) and admin networks. Do not expose port 9090 to the public internet without a TLS-terminating reverse proxy in front — Prometheus has no auth and the /api endpoints expose all metrics + the lifecycle API.
Click Review + create, wait for validation, then Create. Deployment takes around two minutes.
Step 2: Deploy from the Azure CLI
RG="prometheus-prod"
LOCATION="eastus"
VM_NAME="prometheus-01"
ADMIN_USER="azureuser"
GALLERY_IMAGE_ID="/subscriptions/<sub-id>/resourceGroups/azure-cloudimg/providers/Microsoft.Compute/galleries/cloudimgGallery/images/prometheus-3-ubuntu-24-04/versions/<version>"
SSH_KEY="$(cat ~/.ssh/id_rsa.pub)"

az group create --name "$RG" --location "$LOCATION"

az network vnet create \
  --resource-group "$RG" \
  --name prom-vnet --address-prefix 10.95.0.0/16 \
  --subnet-name prom-subnet --subnet-prefix 10.95.1.0/24

az network nsg create --resource-group "$RG" --name prom-nsg

az network nsg rule create \
  --resource-group "$RG" --nsg-name prom-nsg \
  --name allow-ssh --priority 100 \
  --source-address-prefixes "<your-mgmt-cidr>" \
  --destination-port-ranges 22 --access Allow --protocol Tcp

az network nsg rule create \
  --resource-group "$RG" --nsg-name prom-nsg \
  --name allow-prometheus-vnet --priority 110 \
  --source-address-prefixes 10.95.0.0/16 \
  --destination-port-ranges 9090 --access Allow --protocol Tcp

az vm create \
  --resource-group "$RG" --name "$VM_NAME" \
  --image "$GALLERY_IMAGE_ID" \
  --size Standard_B2s --storage-sku StandardSSD_LRS \
  --admin-username "$ADMIN_USER" --ssh-key-values "$SSH_KEY" \
  --vnet-name prom-vnet --subnet prom-subnet --nsg prom-nsg \
  --public-ip-sku Standard
Step 3: Connect via SSH
ssh azureuser@<vm-ip>
prometheus.service will already be running and prometheus-firstboot.service will already have written the endpoint info file.
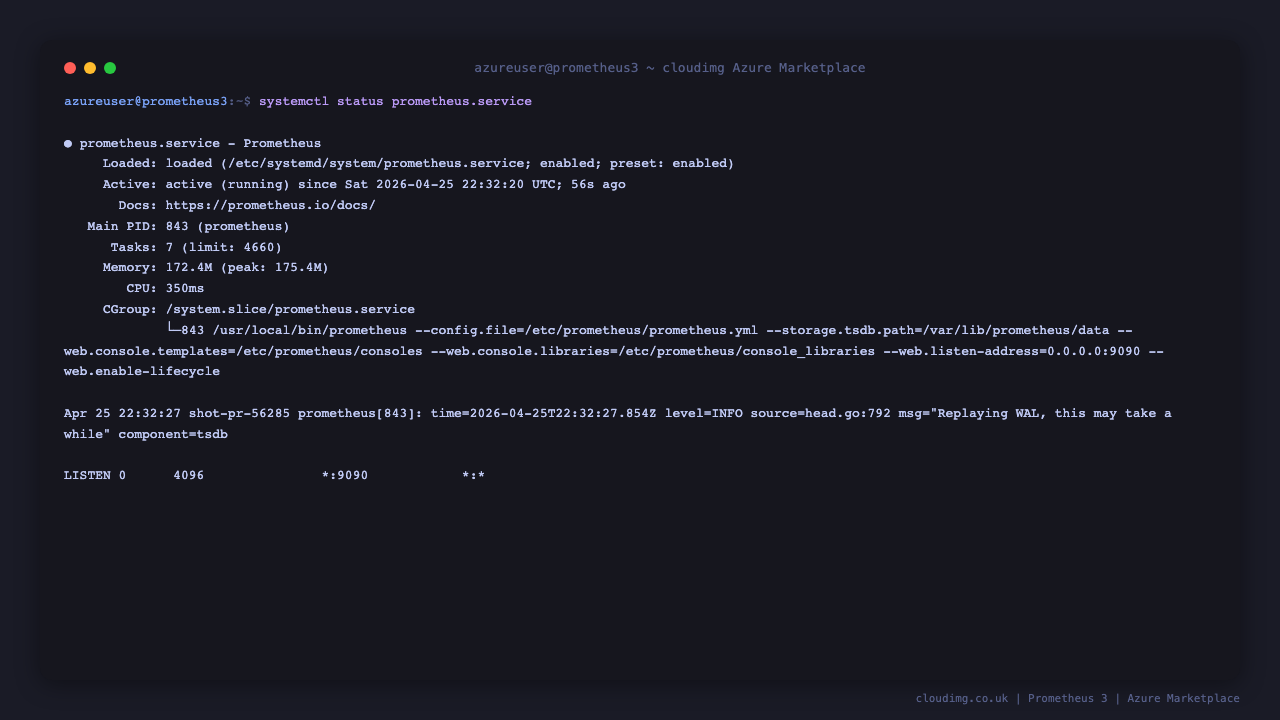
Step 4: Verify the Prometheus Service
sudo systemctl status prometheus.service --no-pager
Expected: active (running). Confirm the firstboot sentinel:
sudo test -f /var/lib/cloudimg/prometheus-firstboot.done && echo FIRSTBOOT_DONE
Confirm the listener:
sudo ss -tln | grep 9090
Confirm health + ready:
curl -s http://localhost:9090/-/healthy
echo
curl -s http://localhost:9090/-/ready
Confirm the version via the API:
curl -s http://localhost:9090/api/v1/status/buildinfo | jq -r '.data.version'
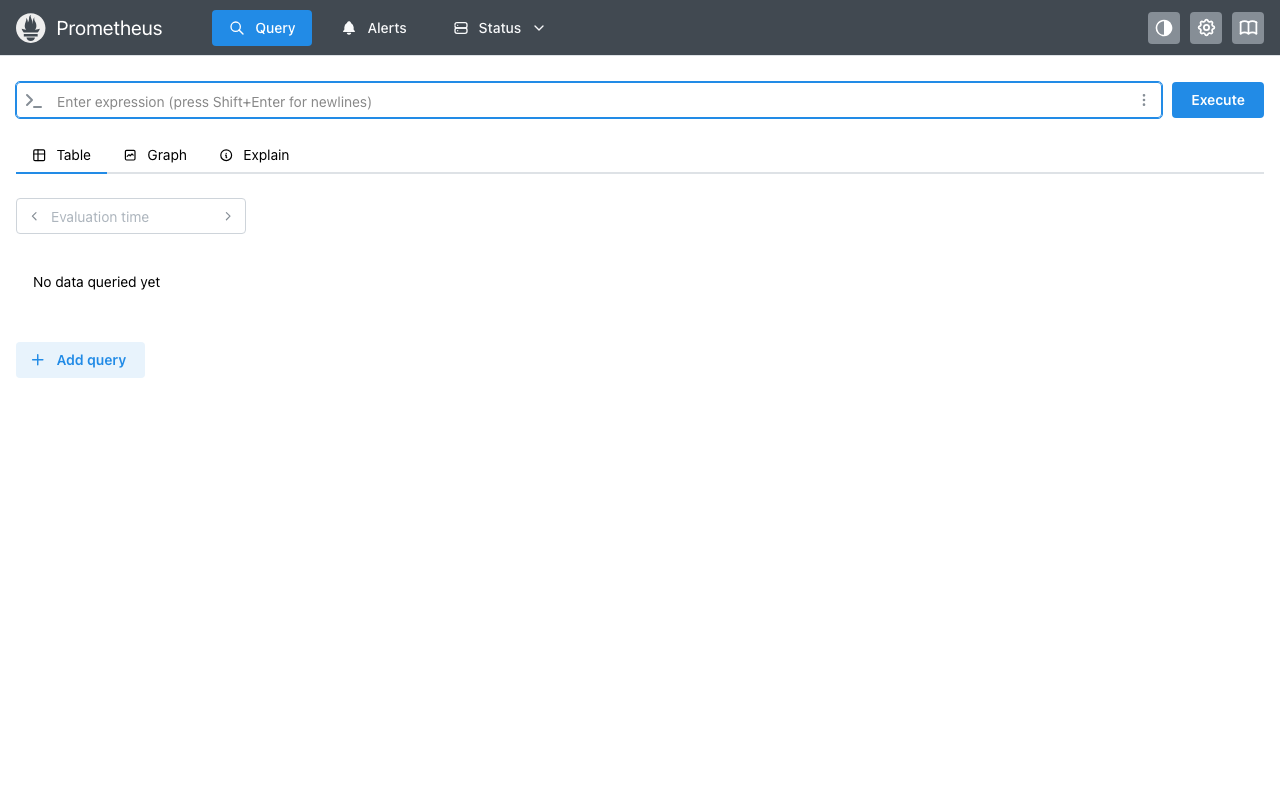
Step 5: Open the Expression UI
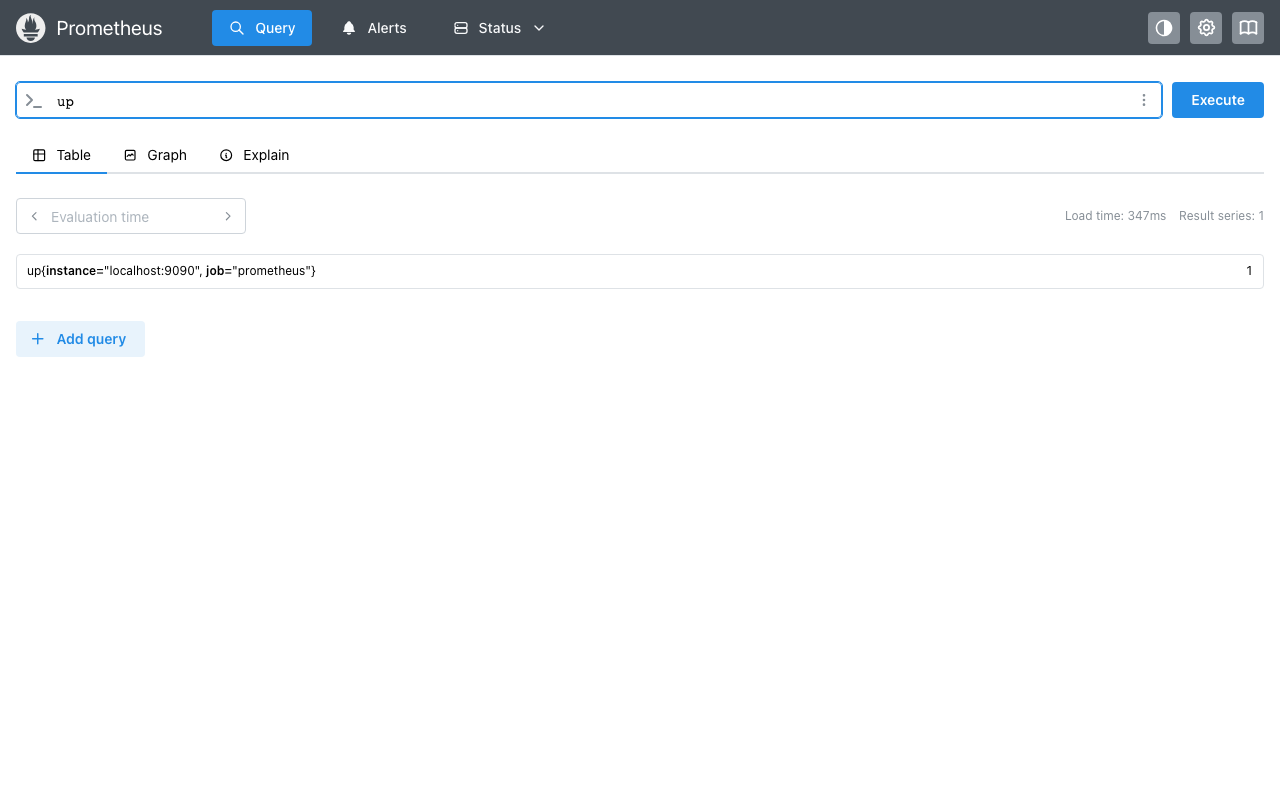
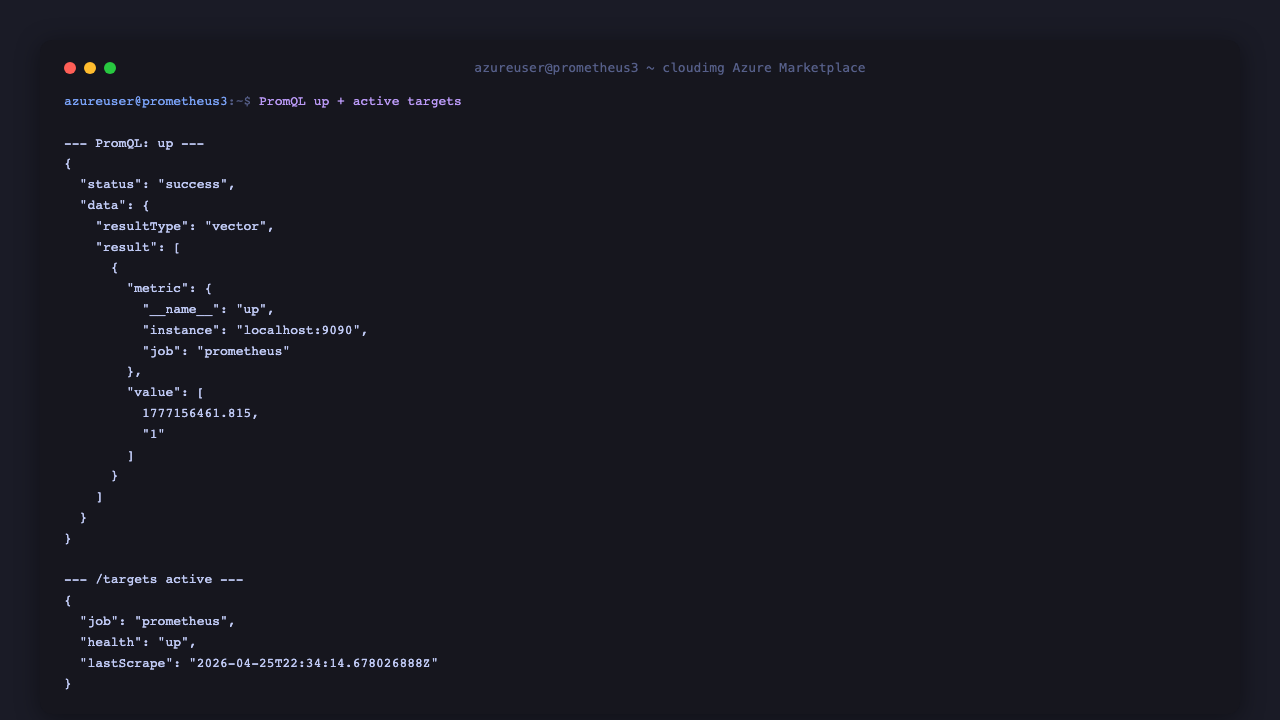
Open http://<vm-ip>:9090 in your browser. Prometheus 3 lands on the expression UI ready for PromQL queries:
Type up in the expression box (or click Execute on any pre-filled query) to see the most basic PromQL probe — every active scrape target reports 1 if it answered the last scrape, 0 if it did not:
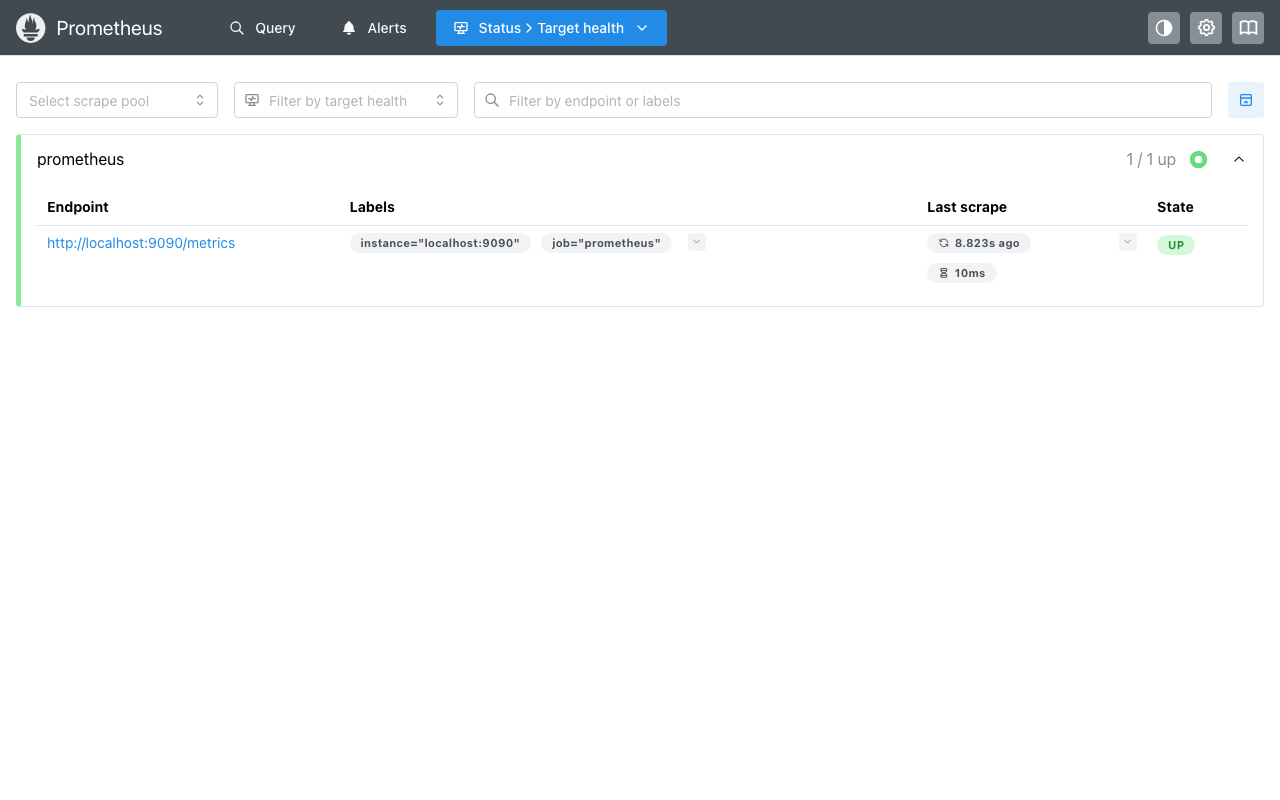
Step 6: Inspect Active Targets
Navigate to Status → Target health in the top nav (or hit /targets directly). On a fresh VM the prometheus self-monitoring job is the only configured target:
To add more targets, edit /etc/prometheus/prometheus.yml (Step 7), then reload:
sudo curl -s -X POST http://localhost:9090/-/reload
The --web.enable-lifecycle flag is set in the systemd unit so reloads do not require restarting the service.
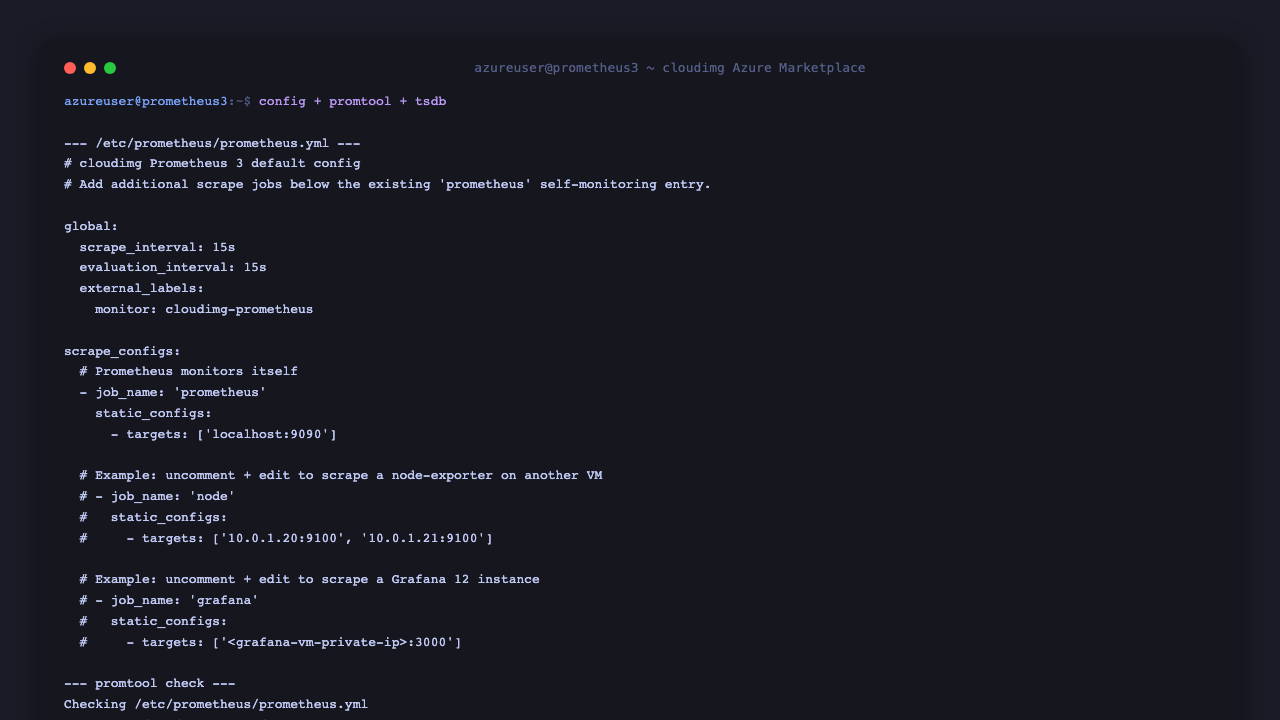
Step 7: Add Scrape Targets
The default config has two example jobs commented in. Edit /etc/prometheus/prometheus.yml:
sudo cat /etc/prometheus/prometheus.yml
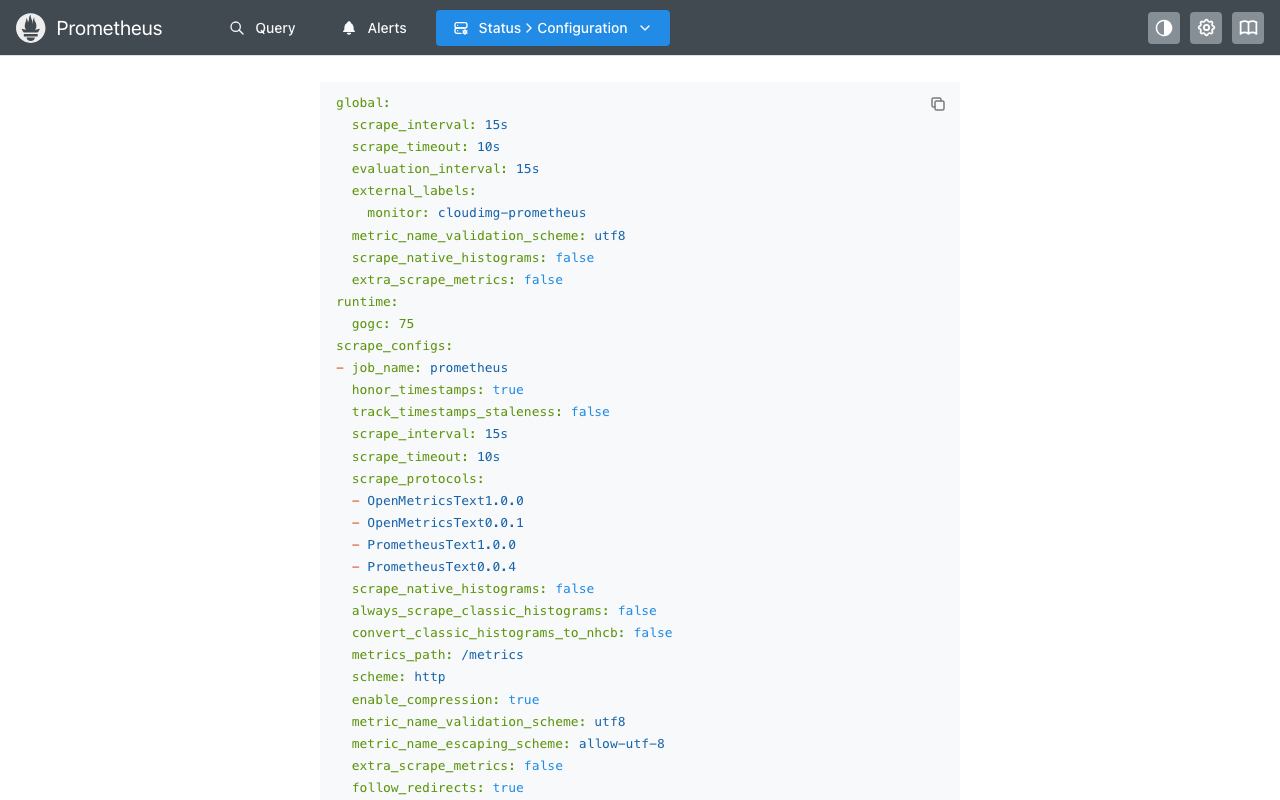
You can view the active config from the UI under Status → Configuration:
Common pairings:
-
node-exporter on every VM you want to monitor — install on each target VM (
apt-get install -y prometheus-node-exporter), point a Prometheus job at port 9100 -
Grafana for dashboards — pair with the cloudimg
grafana-12-ubuntu-24-04image, add Prometheus as a data source in Grafana with URLhttp://<this-vm-private-ip>:9090 -
Application metrics — every Spring Boot, Go, Python (prometheus_client), Node.js (prom-client) framework can expose a
/metricsendpoint in the Prometheus text format
After editing the config, validate with promtool before reloading:
sudo -u prometheus promtool check config /etc/prometheus/prometheus.yml
sudo curl -s -X POST http://localhost:9090/-/reload
Step 8: Server Status
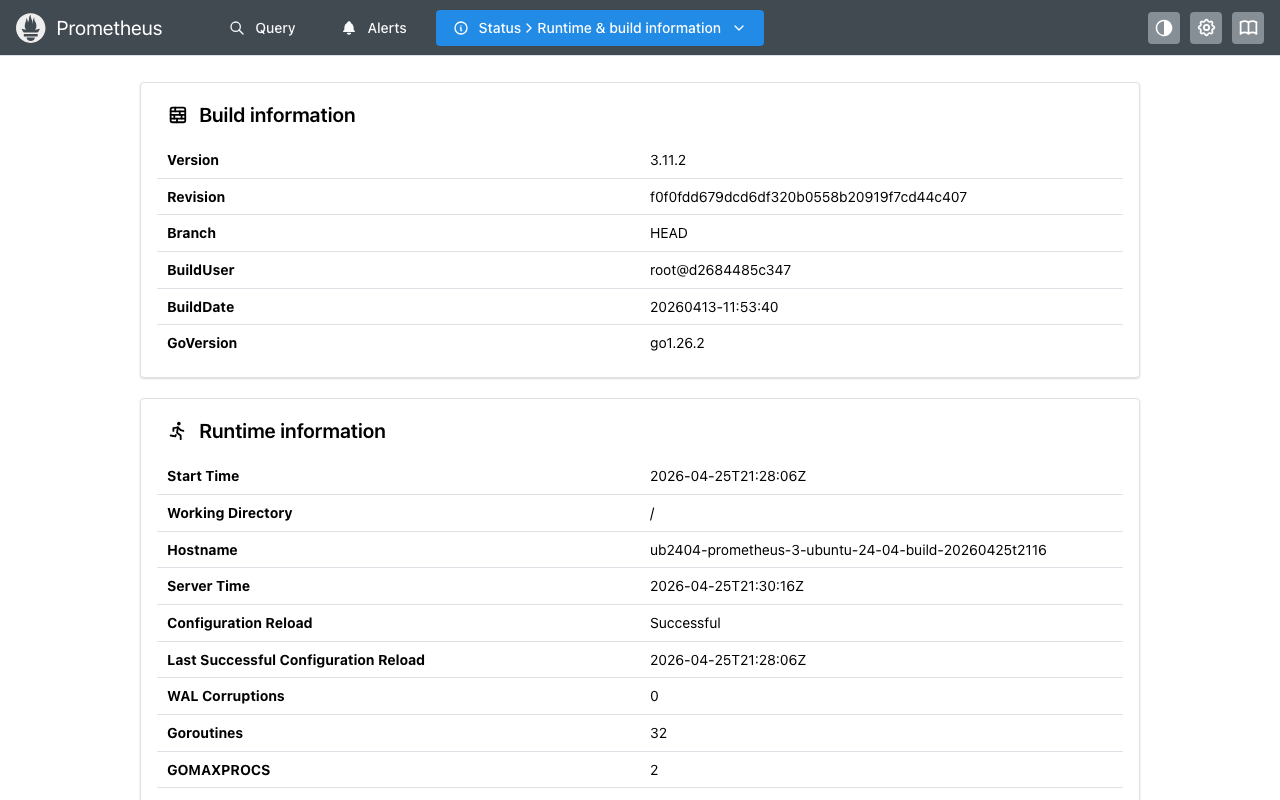
The Status page shows runtime + build info, command-line flags, and feature flags:
Step 9: Server Components
Component Path
Prometheus binary /usr/local/bin/prometheus
promtool /usr/local/bin/promtool
Config file /etc/prometheus/prometheus.yml
Console templates /etc/prometheus/consoles/
Console libraries /etc/prometheus/console_libraries/
TSDB data /var/lib/prometheus/data
Systemd unit /etc/systemd/system/prometheus.service
Firstboot script /usr/local/sbin/prometheus-firstboot.sh
Firstboot service /etc/systemd/system/prometheus-firstboot.service
Endpoint info file /stage/scripts/prometheus-credentials.log
Firstboot sentinel /var/lib/cloudimg/prometheus-firstboot.done
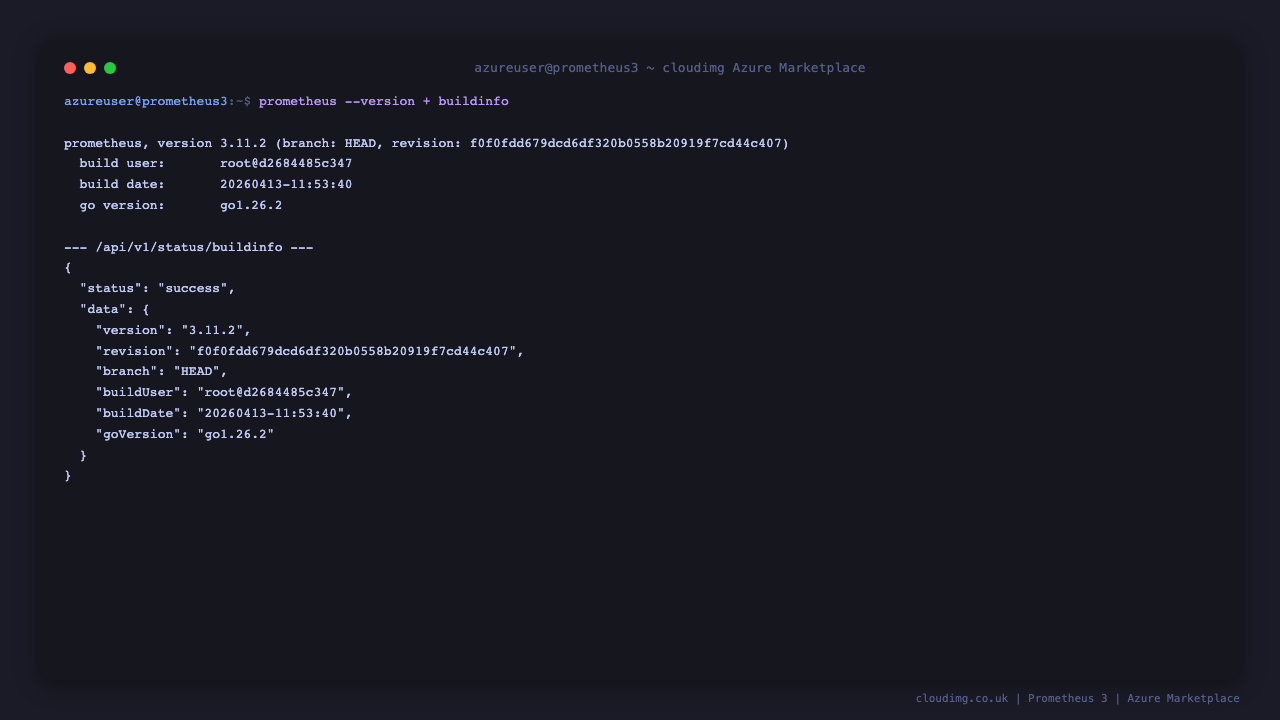
Inspect installed version:
/usr/local/bin/prometheus --version 2>&1 | head -1
Step 10: Managing the Prometheus Service
Status:
sudo systemctl status prometheus.service --no-pager
Stop / Start / Restart:
sudo systemctl stop prometheus.service
sudo systemctl start prometheus.service
sudo systemctl restart prometheus.service
Reload config without restart:
sudo curl -s -X POST http://localhost:9090/-/reload
View journal:
sudo journalctl -u prometheus.service --no-pager -n 50
Validate config:
sudo -u prometheus /usr/local/bin/promtool check config /etc/prometheus/prometheus.yml
Step 11: Add Authentication via Reverse Proxy
For any non-loopback exposure, front Prometheus with Nginx + basic auth:
sudo apt-get update -y
sudo apt-get install -y nginx apache2-utils
sudo htpasswd -c /etc/nginx/.prometheus.htpasswd <admin-user>
Drop a config at /etc/nginx/sites-available/prometheus.conf:
server {
    listen 80;
    server_name <your-domain>;
    auth_basic "Prometheus";
    auth_basic_user_file /etc/nginx/.prometheus.htpasswd;
    location / {
        proxy_pass http://127.0.0.1:9090;
        proxy_set_header Host $host;
        proxy_set_header X-Real-IP $remote_addr;
    }
}
Then enable + restart:
sudo ln -s /etc/nginx/sites-available/prometheus.conf /etc/nginx/sites-enabled/
sudo nginx -t && sudo systemctl reload nginx
Restrict NSG to expose 80/443 publicly and 9090 only to localhost. The cloudimg nginx-ssl-certbot-ubuntu-24-04 image deploys all of this plus Let's Encrypt TLS in one step.
Step 12: Troubleshooting
Cannot reach Prometheus on port 9090
-
Confirm service running:
sudo systemctl status prometheus.service -
Confirm listener bound:
sudo ss -tln | grep 9090 -
Check journal:
sudo journalctl -u prometheus.service --no-pager -n 50 -
Confirm NSG allows TCP 9090 from your client source IP
Self-monitoring target shows DOWN on /targets
-
Open
/targetsand check theLast Errorcolumn -
Confirm Prometheus can reach
localhost:9090(it always should — this is a one-line sanity check) -
If DOWN:
curl -s http://localhost:9090/-/readyand check the journal
PromQL queries return empty
-
Wait one scrape interval (15s default) after a fresh start before querying
-
Confirm targets are UP at
/targets -
Confirm the metric name exists:
curl -s 'http://localhost:9090/api/v1/label/__name__/values' | jq '.data | length'
Config reload fails
-
Validate first:
sudo -u prometheus /usr/local/bin/promtool check config /etc/prometheus/prometheus.yml -
Check the journal for the parse error:
sudo journalctl -u prometheus.service --no-pager -n 20
TSDB disk full
-
Check usage:
sudo du -sh /var/lib/prometheus/data -
Reduce retention: add
--storage.tsdb.retention.time=15dto the systemd unit ExecStart and restart -
Consider remote-write to Cortex/Mimir/Thanos for long-term storage instead of growing the local TSDB
Step 13: Security Recommendations
-
Front Prometheus with TLS + auth before any non-loopback exposure (Step 11)
-
Restrict NSG so port 9090 is only reachable from your scrape clients (Grafana VM, alertmanager VM) and admin networks
-
Disable the lifecycle API in production if you do not need hot reloads — remove
--web.enable-lifecyclefrom the systemd unit (you'll need asystemctl restart prometheusfor config changes after that) -
Use a separate user for Alertmanager / federation reads by terminating those at the reverse proxy with their own credentials
-
Enable Prometheus TLS for federation (the
--web.config.file=flag) if you have a multi-Prometheus setup -
Back up the TSDB with
promtool tsdb create-blocks-from snapshotsfor important long-term metrics -
Keep Prometheus updated by re-installing the latest tarball from
github.com/prometheus/prometheus/releasesperiodically
Step 14: Support and Licensing
Prometheus is licensed under the Apache License 2.0. There is no per-target, per-metric, or per-server fee. Prometheus is a graduated CNCF project.
cloudimg provides commercial support for this image separately from the upstream project.
-
Email: support@cloudimg.co.uk
-
Website: www.cloudimg.co.uk
-
Support hours: 24/7 with guaranteed 24 hour response SLA
Deploy on Azure
Launch Prometheus 3 on Ubuntu 24.04 with 24/7 support from cloudimg.
View on Marketplace
Need Help?
Our support team is available 24/7.
support@cloudimg.co.uk