
Redash on AWS User Guide
Overview
This image runs Redash, the open source data visualisation, SQL query and dashboard platform. Connect to a data source, write a query in the shared SQL editor, turn the result into a chart, and combine charts onto interactive dashboards you can schedule and share.
The appliance is the official Redash production Docker Compose stack, pinned to a fixed release so the image never silently upgrades. It runs the Redash web server, the scheduler and two Celery workers alongside a PostgreSQL metadata database and a Redis broker, all on a private Docker network. A system nginx reverse proxy is the only thing exposed on the public interface: it terminates port 80 and forwards to the Redash server on 127.0.0.1:5000, while PostgreSQL and Redis are never published to the network. An unauthenticated health endpoint is served at /health for load balancer and readiness probes.
There are no default credentials in the image. On the first boot of every deployed instance a fresh Redash secret key, cookie secret and database password are generated, the metadata database is initialised empty, and a unique administrator account is created and written to /root/redash-credentials.txt with mode 0600. The PostgreSQL and Redis data live on a dedicated, independently resizable EBS data volume mounted at /var/lib/redash, separate from the operating system disk.
Prerequisites
Before you deploy this image you need:
- An Amazon Web Services account where you can launch EC2 instances
- IAM permissions to launch instances, create security groups, and subscribe to AWS Marketplace products
- An EC2 key pair in the target Region for SSH access to the instance
- A VPC and subnet in the target Region, with a security group allowing inbound port 22 from your management network and inbound port 80 (and 443 once you add TLS) from the networks your users will reach Redash on
- The AWS CLI (version 2) installed locally if you plan to deploy from the command line
- A data source to analyse (PostgreSQL, MySQL, SQL Server, Amazon Redshift, Amazon Athena, BigQuery, Elasticsearch and many more) - the bundled PostgreSQL metadata database can be connected first to explore
Step 1: Launch the Instance from the AWS Marketplace
Sign in to the AWS Management Console, open the EC2 service, and select Launch instance. Under Application and OS Images choose AWS Marketplace AMIs and search for Redash. Select the cloudimg listing and choose Select, then Continue on the subscription summary.
Pick an instance type of m5.large or larger - Redash runs several containers (the web server, scheduler, two workers, PostgreSQL and Redis) and benefits from memory. Choose your EC2 key pair under Key pair (login). Under Network settings select your VPC and subnet, and either create or select a security group that allows inbound port 22 from your management network and inbound port 80 (and 443) from the networks your users use. Leave the root volume at the default size or larger; the metadata database and Redis data are stored on the separate data volume.
Select Launch instance. First boot initialisation takes approximately three to five minutes after the instance state becomes Running (Redash rotates every secret, initialises the database, runs its migrations and creates the administrator on first boot).
Step 2: Launch the Instance from the AWS CLI
The following block launches an instance from the cloudimg Redash Marketplace AMI into an existing subnet and security group. Replace <ami-id> with the AMI ID shown on the Marketplace listing, <key-name> with your EC2 key pair name, <subnet-id> with your subnet ID, and <security-group-id> with a security group that opens ports 22 and 80 (and 443) as described above.
aws ec2 run-instances \
  --image-id <ami-id> \
  --instance-type m5.large \
  --key-name <key-name> \
  --subnet-id <subnet-id> \
  --security-group-ids <security-group-id> \
  --block-device-mappings '[{"DeviceName":"/dev/sda1","Ebs":{"VolumeSize":30,"VolumeType":"gp3"}}]' \
  --tag-specifications 'ResourceType=instance,Tags=[{Key=Name,Value=redash-01}]'
The command prints a JSON document on success. Note the instance ID, then retrieve its public address once it is running with aws ec2 describe-instances --instance-ids <instance-id> --query "Reservations[].Instances[].PublicIpAddress" --output text.
Step 3: Connect and Retrieve the Administrator Login
Connect over SSH with the key pair you selected and the public IP address from step 2. The SSH login user depends on the operating system of the AMI variant you launched:
| AMI variant | SSH login user |
|---|---|
| Redash 10.1 on Ubuntu 24.04 | ubuntu |
ssh <login-user>@<public-ip>
Once connected, read the per instance credentials file. The first boot service completes before the credentials file is written, so it is in place when you first log in:
sudo cat /root/redash-credentials.txt
You will see a plain text file containing the Redash URL, the administrator email (admin@cloudimg.local), the generated administrator password and an API key. From the same SSH session you can confirm the deployment is healthy - the health endpoint is open and unauthenticated:
curl -fsS http://127.0.0.1/health
OK
The proxied Redash server also answers its own readiness probe with HTTP 200:
curl -s -o /dev/null -w 'ping: HTTP %{http_code}\n' http://127.0.0.1/ping
Step 4: First Sign-in
Open a web browser and navigate to http://<public-ip>/. Because first boot already created the administrator, you go straight to the sign-in page - enter the email and password from /root/redash-credentials.txt.
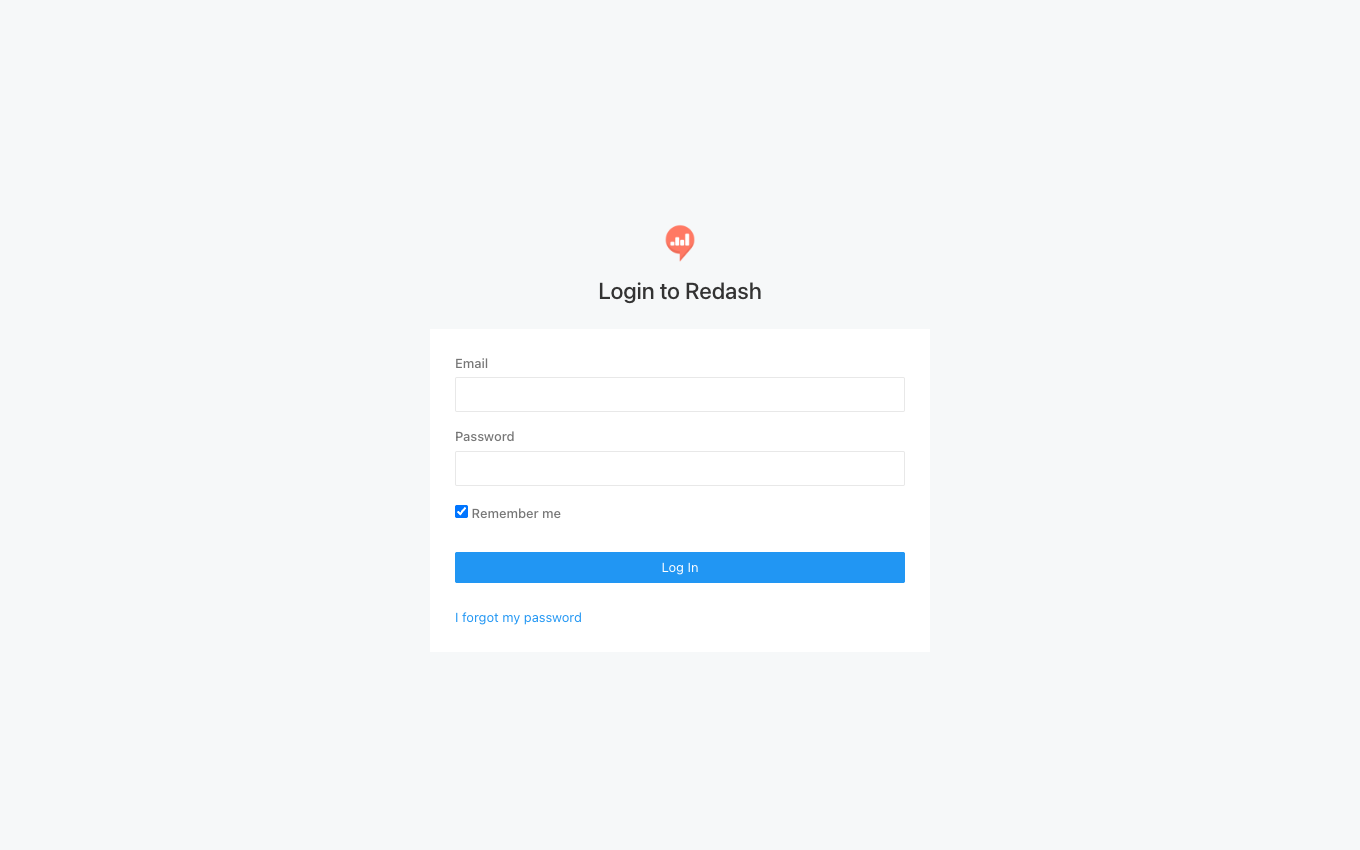
The Redash sign-in page, served on first boot with a unique per-instance administrator and no default credentials.
After signing in you reach the Redash home, with the getting started checklist, favourite dashboards and queries, and the Dashboards, Queries, Alerts and Create navigation.
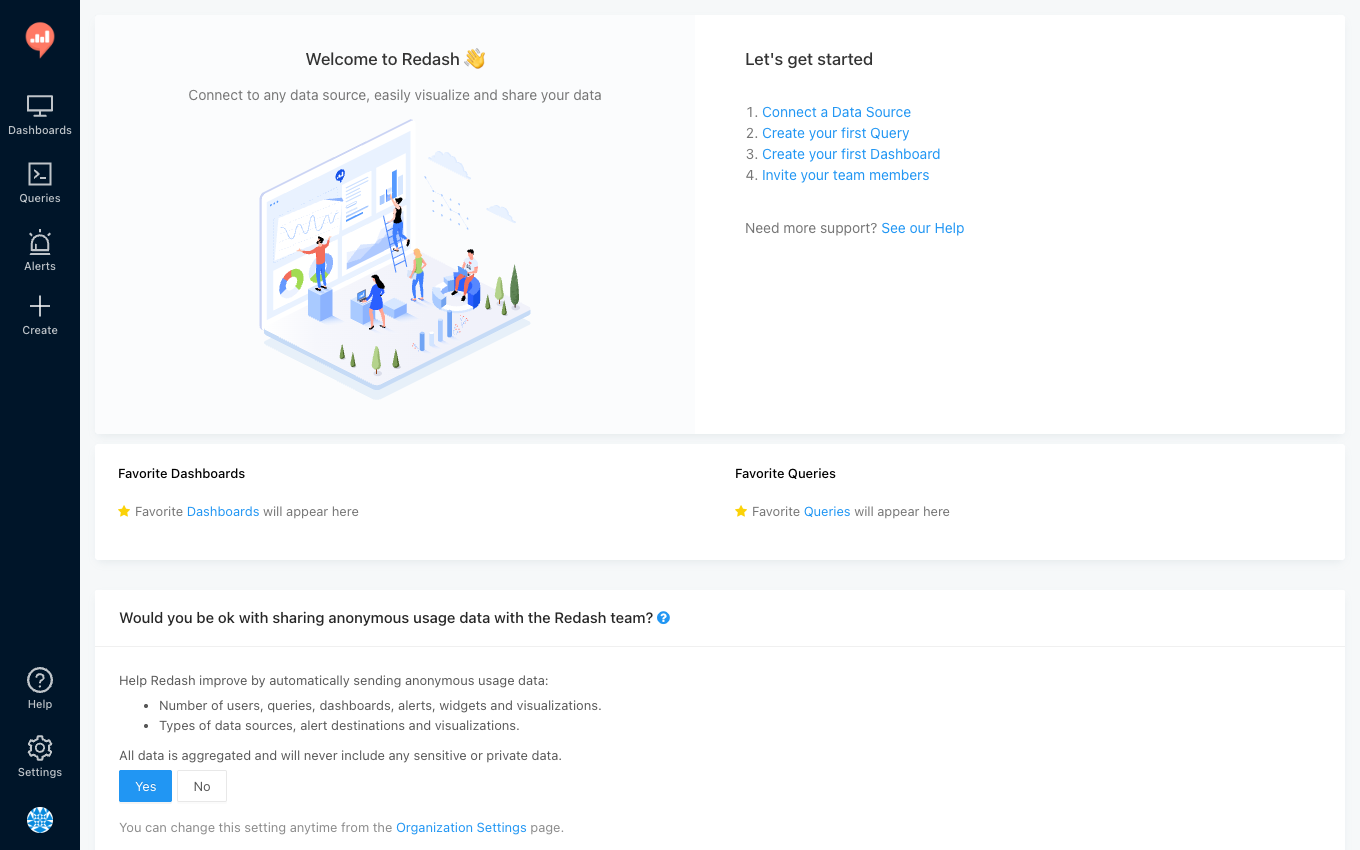
The Redash home - connect a data source, create a query and build a dashboard.
Step 5: Connect a Data Source
Redash connects to your databases, warehouses and APIs. Open Settings (the gear icon), then Data Sources, then New Data Source, and choose a type - PostgreSQL, MySQL, SQL Server, Amazon Redshift, Amazon Athena, BigQuery, Elasticsearch and dozens more are supported. Supply the host, port and credentials, then Save and Test Connection. For an Amazon RDS or Redshift instance in the same VPC, use its endpoint and database name.
Step 6: Write a Query and Build a Chart
Select Create, then Query, choose your data source, write SQL in the editor and Execute. The result appears as a table; select Add Visualization to turn it into a chart (bar, line, pie, scatter, map, counter, pivot and more), then Save the query. The screenshot below shows a query running against the bundled PostgreSQL data source and its result rendered as a bar chart.
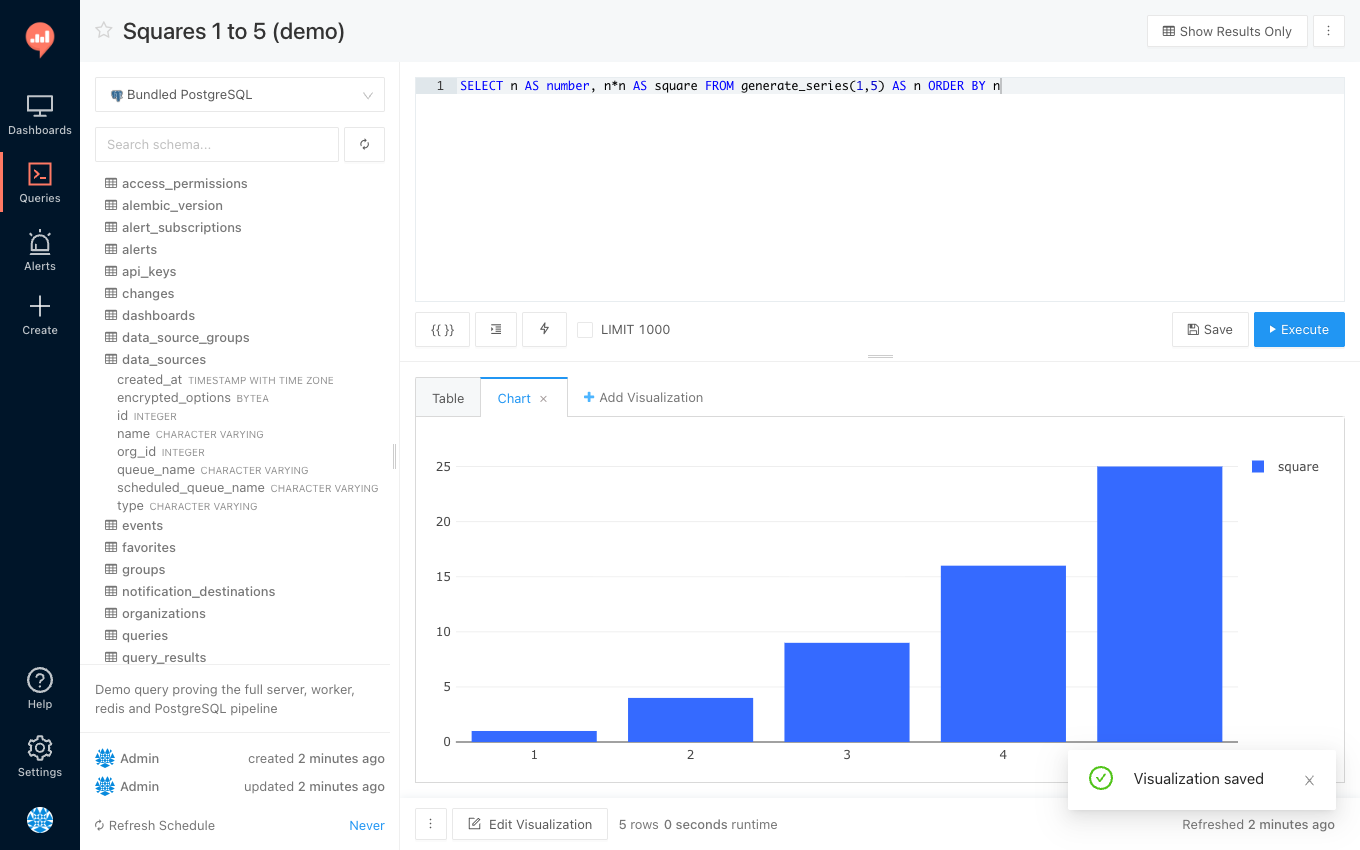
A SQL query executed against a connected data source, with the result rendered as a chart ready to add to a dashboard.
Combine saved queries and their visualisations onto a Dashboard (from Create, then Dashboard) with filters and parameters for an at-a-glance view, and schedule queries to refresh automatically.
Step 7: Verify the Full Query Pipeline (optional)
You can prove the whole stack - the web server, the Celery workers, Redis and PostgreSQL - end to end from the shell using the REST API and the API key from your credentials file. This block connects the bundled PostgreSQL metadata database as a data source, runs an ad-hoc query through the worker pipeline, and prints the returned rows.
sudo bash -c '
set -e
API=$(grep "^REDASH_ADMIN_API_KEY=" /root/redash-credentials.txt | cut -d= -f2-)
PGPW=$(grep "^POSTGRES_PASSWORD=" /opt/redash/.env | cut -d= -f2-)
H="http://127.0.0.1"; A="Authorization: Key ${API}"; CT="Content-Type: application/json"
DSID=$(curl -s -H "$A" "$H/api/data_sources" | python3 -c "import json,sys;d=json.load(sys.stdin);print(next((x[\"id\"] for x in d if x[\"name\"]==\"cloudimg verify\"), \"\"))")
if [ -z "$DSID" ]; then
  DSID=$(curl -s -H "$A" -H "$CT" -X POST "$H/api/data_sources" -d "{\"name\":\"cloudimg verify\",\"type\":\"pg\",\"options\":{\"host\":\"postgres\",\"port\":5432,\"user\":\"postgres\",\"password\":\"${PGPW}\",\"dbname\":\"postgres\"}}" | python3 -c "import json,sys;print(json.load(sys.stdin)[\"id\"])")
fi
JID=$(curl -s -H "$A" -H "$CT" -X POST "$H/api/query_results" -d "{\"data_source_id\":${DSID},\"query\":\"SELECT n AS number, n*n AS square FROM generate_series(1,5) AS n ORDER BY n\",\"max_age\":0}" | python3 -c "import json,sys;print(json.load(sys.stdin)[\"job\"][\"id\"])")
for i in $(seq 1 30); do
  QRID=$(curl -s -H "$A" "$H/api/jobs/${JID}" | python3 -c "import json,sys;print(json.load(sys.stdin)[\"job\"].get(\"query_result_id\") or \"\")")
  [ -n "$QRID" ] && break; sleep 2
done
[ -n "$QRID" ] || { echo "FAILED: query did not complete"; exit 1; }
curl -s -H "$A" "$H/api/query_results/${QRID}" | python3 -c "import json,sys;d=json.load(sys.stdin)[\"query_result\"][\"data\"];print(\"columns:\",[c[\"name\"] for c in d[\"columns\"]]);print(\"rows:\",d[\"rows\"])"
'
A columns: and rows: line listing the five squared numbers confirms the full server, worker, Redis and PostgreSQL pipeline is healthy.
Step 8: Enable HTTPS with Let's Encrypt
For any production deployment serve Redash over HTTPS so session cookies and data cannot be intercepted. The image ships with nginx, which certbot can configure automatically. The following assumes you have a DNS record pointing your fully qualified domain name at the instance's public IP address.
sudo apt-get update && sudo apt-get install -y certbot python3-certbot-nginx
sudo certbot --nginx -d redash.your-domain.example \
  --non-interactive --agree-tos -m you@your-domain.example \
  --redirect
After certbot finishes, set REDASH_HOST in /opt/redash/.env to https://redash.your-domain.example so Redash generates correct links, then restart the stack with sudo systemctl restart redash.
Step 9: Backups and Maintenance
Redash keeps all of its state - users, data source definitions, queries, dashboards, alerts and cached results - in its PostgreSQL metadata database, which lives on the dedicated data volume. Back it up regularly by dumping it from the database container:
sudo docker compose -f /opt/redash/docker-compose.yml exec -T postgres pg_dump -U postgres postgres > <backup-dir>/redash-metadata-$(date +%F).sql
Ship the dump to an Amazon S3 bucket or another object store. Because the metadata database is on its own EBS volume, you can also take coordinated EBS snapshots of it. For kernel and package updates, Ubuntu's unattended-upgrades is enabled by default. The Redash container images are pinned in /opt/redash/docker-compose.yml; to upgrade Redash, change the pinned tag and run sudo systemctl restart redash, which recreates the stack and applies any database migrations. Always back up first. See https://redash.io/help/.
Step 10: Scaling Beyond a Single Instance
For larger deployments decouple Redash from the single instance pattern:
- Move the metadata database to Amazon RDS for PostgreSQL and point
REDASH_DATABASE_URLin/opt/redash/.envat it - Move the broker to Amazon ElastiCache for Redis and point
REDASH_REDIS_URLat it - Put the web tier behind an Application Load Balancer and scale the worker containers for query concurrency
Each of these is documented in the official Redash documentation at https://redash.io/help/.
Support
cloudimg provides 24/7/365 expert technical support for this image. Guaranteed response within 24 hours, one hour average for critical issues. Contact support@cloudimg.co.uk.
For general Redash questions consult the documentation at https://redash.io/help/. Redash is distributed under the BSD 2-Clause License; use of the name here is nominative and does not imply affiliation or endorsement.