Telegraf on Ubuntu 24.04 on Azure User Guide
Overview
Telegraf is the open-source, plugin-driven server agent from InfluxData for collecting and reporting metrics. It has more than 240 input plugins to gather metrics from the system, services and third-party APIs, and dozens of output plugins to report them to time-series databases, message queues and monitoring backends - all from a single lightweight binary. The cloudimg image installs Telegraf from the official InfluxData apt repository as /usr/bin/telegraf, ships a clear ready-to-run sample configuration, and exposes the collected metrics on a built-in Prometheus endpoint so you can scrape them from the moment the VM boots. Backed by 24/7 cloudimg support.
What is included:
- Telegraf (MIT licensed) from the official InfluxData apt repository
- The package
telegraf.servicesystemd unit, enabled and running on boot - A sample configuration at
/etc/telegraf/telegraf.conf:cpu,mem,disk,systemandnetinputs, with two outputs (a file under/var/log/telegraf/and a Prometheus client endpoint) - The built-in Prometheus metrics endpoint on
127.0.0.1:9273(/metrics) - 24/7 cloudimg support
This is a headless service product: the Prometheus client endpoint binds to 127.0.0.1 only, so no inbound application port is needed beyond SSH.
Prerequisites
An active Azure subscription, an SSH key pair, and a VNet + subnet in the target region. Standard_B2s (2 vCPU / 4 GiB RAM) is a good starting point. NSG inbound: allow 22/tcp from your management network. No inbound application ports are required.
Step 1 - Deploy from the Azure Marketplace
Sign in to the Azure Portal, choose Create a resource, search the Marketplace for Telegraf by cloudimg, and select Create. On Basics pick your subscription, resource group, region and size; under Administrator account choose SSH public key and paste your key; under Inbound port rules allow SSH (22). Then Review + create -> Create.
Step 2 - Deploy from the Azure CLI
az vm create \
  --resource-group <your-rg> \
  --name telegraf \
  --image <marketplace-image-urn> \
  --size Standard_B2s \
  --admin-username azureuser \
  --ssh-key-values ~/.ssh/id_ed25519.pub \
  --vnet-name <your-vnet> --subnet <your-subnet> \
  --public-ip-sku Standard
Step 3 - Connect to your VM
ssh azureuser@<vm-public-ip>
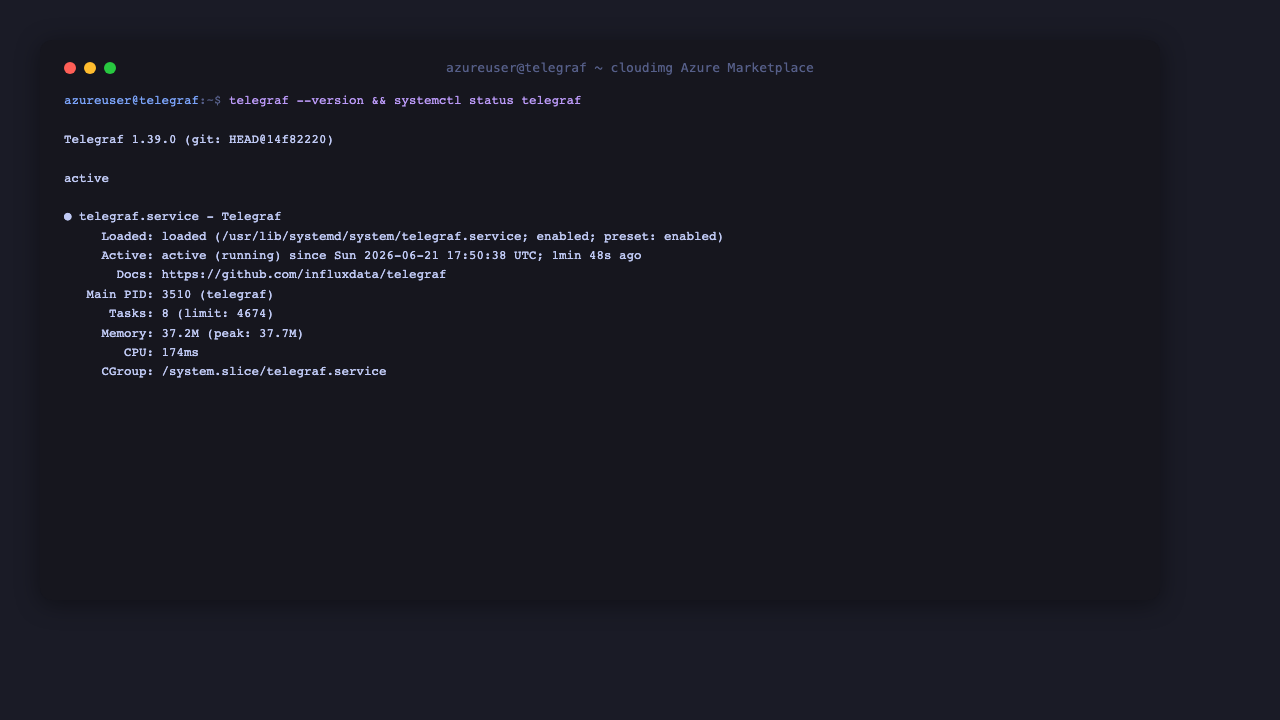
Step 4 - Confirm Telegraf is installed and running
Check the version and that the service is active:
telegraf --version
systemctl is-active telegraf
telegraf --version reports Telegraf 1.x, and systemctl is-active telegraf prints active.
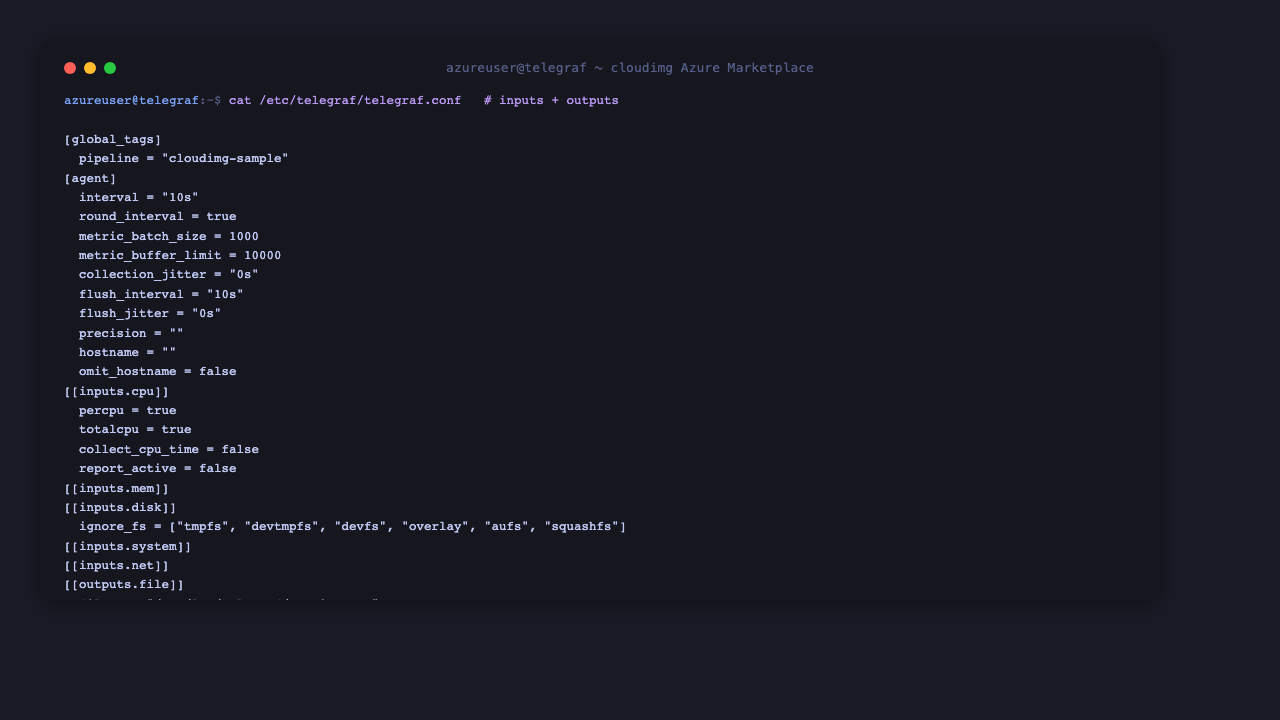
Step 5 - Review the sample configuration
The ready-to-run configuration lives at /etc/telegraf/telegraf.conf. It collects host metrics every 10 seconds from the cpu, mem, disk, system and net input plugins, and fans the stream out to two outputs: a file under /var/log/telegraf/ and a Prometheus client endpoint:
cat /etc/telegraf/telegraf.conf
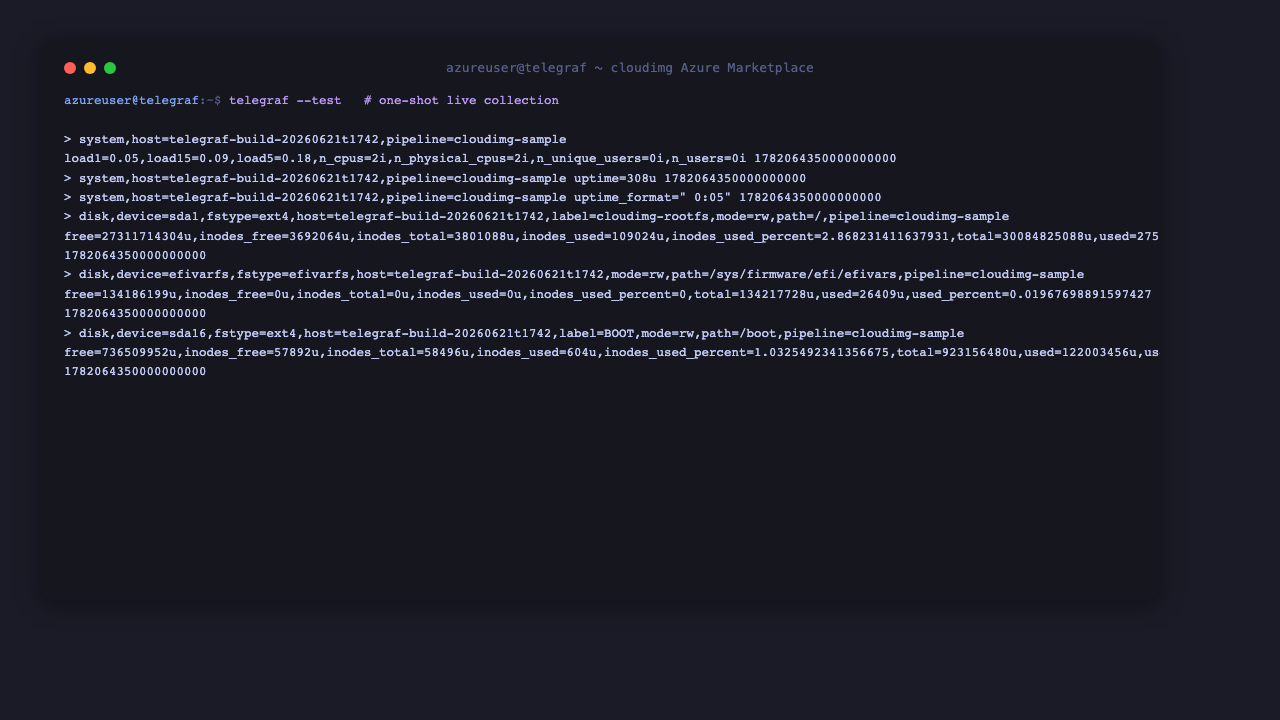
Step 6 - Collect metrics on demand with telegraf --test
Run a single one-shot collection across every configured input and print the metrics to your terminal in line protocol - a quick way to see exactly what Telegraf is gathering without touching the running service:
telegraf --test
Each line is a measurement (mem, disk, system, net, and after a couple of intervals cpu) stamped with your hostname and the cloudimg-sample pipeline tag.
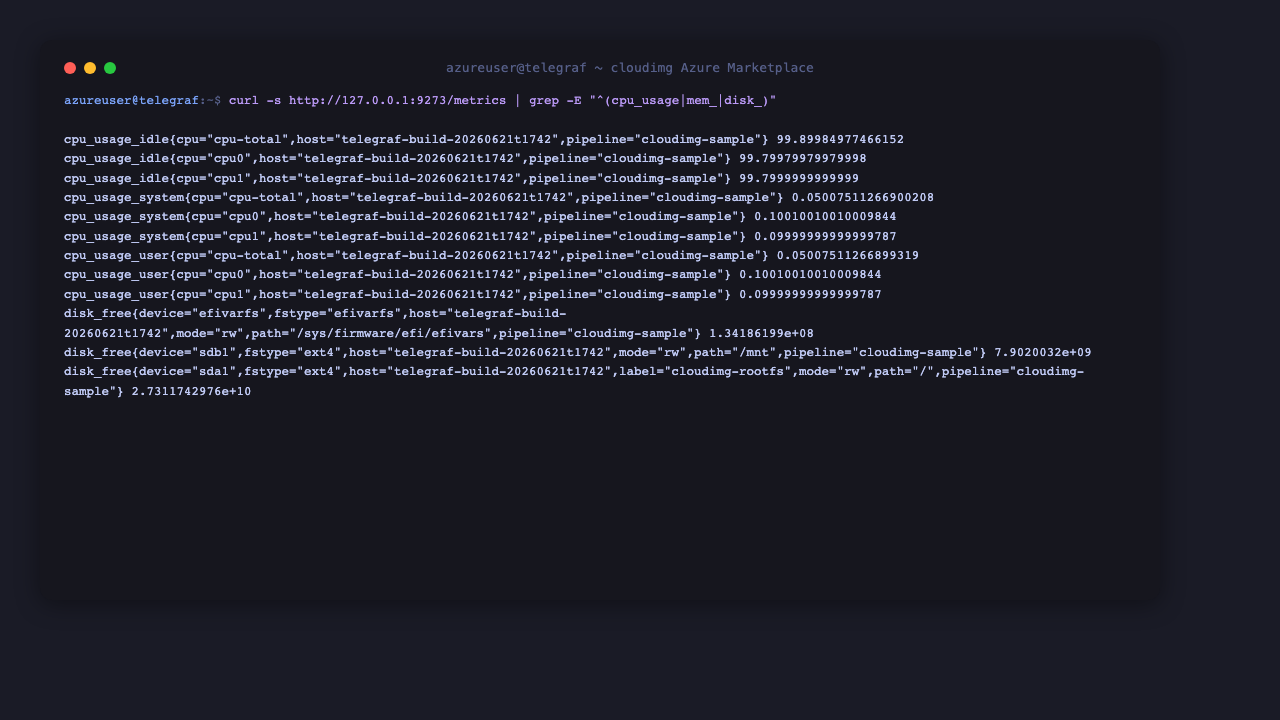
Step 7 - Scrape the Prometheus metrics endpoint
The outputs.prometheus_client plugin exposes the collected series on 127.0.0.1:9273. This is the health and scrape endpoint - it returns HTTP 200 with every collected metric in Prometheus exposition format:
curl -s http://127.0.0.1:9273/metrics | sed -n '1,20p'
You will see cpu_usage_*, mem_used*, disk_*, system_* and net_* series, each labelled with the host and pipeline tag.
Step 8 - Watch metrics flow to the file output
The outputs.file plugin writes every collected metric to /var/log/telegraf/metrics.out in InfluxDB line protocol. Tail it to see the live stream:
tail -n 5 /var/log/telegraf/metrics.out
Step 9 - Customise the configuration
Edit /etc/telegraf/telegraf.conf to add your own inputs and outputs, then restart the service. A few common building blocks:
# Collect Docker container metrics
[[inputs.docker]]
  endpoint = "unix:///var/run/docker.sock"

# Scrape an HTTP/JSON API
[[inputs.http]]
  urls = ["http://localhost:8080/metrics"]
  data_format = "prometheus"

# Write to a remote InfluxDB v2
[[outputs.influxdb_v2]]
  urls = ["https://your-influxdb:8086"]
  token = "$INFLUX_TOKEN"
  organization = "your-org"
  bucket = "telegraf"
After editing, validate and apply your changes:
sudo telegraf --config /etc/telegraf/telegraf.conf --test
sudo systemctl restart telegraf
Telegraf ships more than 240 input plugins and dozens of outputs (InfluxDB, Prometheus, Kafka, Elasticsearch, MQTT, Graphite, CloudWatch, Azure Monitor, and many more). See the Telegraf documentation for the full plugin catalogue.
Maintenance
- Service: managed by systemd -
systemctl status telegraf,journalctl -u telegraf. - Configuration:
/etc/telegraf/telegraf.conf; validate withtelegraf --testand restart the service after edits. - Monitoring: the Prometheus client endpoint on
127.0.0.1:9273/metricsexposes every collected series; point your Prometheus scrape config or an SSH tunnel at it. - Upgrades: the package is not held; to upgrade, run
sudo apt-get update && sudo apt-get install --only-upgrade telegraf. - Security patches: unattended-upgrades remains enabled so the OS continues to receive security updates automatically.
Support
cloudimg provides 24/7 expert support for this image. Contact support@cloudimg.co.uk.
Telegraf is a trademark of InfluxData Inc. cloudimg is not affiliated with or endorsed by InfluxData Inc.