
Tianji on AWS User Guide
Overview
Tianji is an all-in-one, open source, self-hosted insight hub. It brings website analytics, uptime and status monitoring, server telemetry and public status pages together under a single dashboard, so you can watch everything that matters about your sites and servers from one place instead of stitching together several separate tools.
This cloudimg image delivers Tianji fully installed and hardened. The Tianji Node.js server runs as a dedicated system user bound to the loopback interface and is reverse-proxied behind nginx on port 80, with PostgreSQL 16 for durable state and WebSocket support for the real-time dashboard. The PostgreSQL database and the Tianji application tree each live on their own dedicated, independently resizable EBS data volume. On the first boot of every instance a one-shot service generates a unique PostgreSQL password, signing secret and administrator password, so no two deployments share a credential and there is no known default login.
Prerequisites
- An AWS account subscribed to this product in AWS Marketplace.
- A key pair in your target region for SSH access.
- A security group that allows inbound TCP 22 (SSH) and TCP 80 (the dashboard) from the addresses you will connect from. Open TCP 443 as well if you plan to add HTTPS, and UDP 12345 only if you will push remote server telemetry to this instance.
Step 1: Launch the Instance from the AWS Marketplace
From the product page in AWS Marketplace select Continue to Subscribe, accept the terms, then Continue to Configuration and Continue to Launch. Choose the recommended instance type (m5.large), your key pair, and a security group with the ports above, then launch.
Step 2: Launch the Instance from the AWS CLI
You can also launch from the CLI. Replace the AMI id, key name, security group and subnet with your own values.
aws ec2 run-instances \
  --image-id <ami-id> \
  --instance-type m5.large \
  --key-name <your-key-pair> \
  --security-group-ids <your-security-group-id> \
  --subnet-id <your-subnet-id> \
  --tag-specifications 'ResourceType=instance,Tags=[{Key=Name,Value=tianji}]'

# Once it is running, find the instance's public IP address:
aws ec2 describe-instances --instance-ids <instance-id> \
  --query 'Reservations[0].Instances[0].PublicIpAddress' --output text
Step 3: Connect and Retrieve the Administrator Login
Connect over SSH with the key pair you selected and the public IP address from step 2. The SSH login user depends on the operating system of the AMI variant you launched:
| AMI variant | SSH login user |
|---|---|
| Tianji 1.32.16 on Ubuntu 24.04 | ubuntu |
The first boot service runs before the SSH daemon becomes ready, so the credentials file is always in place when you log in for the first time.
ssh <login-user>@<public-ip>
sudo cat /root/tianji-credentials.txt
You will see a plain text file containing the Tianji URL, the administrator username (admin) and the password, plus the PostgreSQL database name and role. From the same SSH session you can confirm the deployment is healthy - the health endpoint is open and reports the running version and the database check:
curl -fsS http://127.0.0.1/health
{"status":"healthy","version":"1.32.16","timestamp":"2026-07-22T04:37:53.070Z","duration":0,"checks":{}}
A "healthy" status confirms the full stack - nginx, the Tianji Node.js server and PostgreSQL - is serving.
Step 4: First Sign-in
Open a web browser and navigate to http://<public-ip>/. Tianji presents its sign-in page. Enter the username admin and the password from /root/tianji-credentials.txt, then select Login.
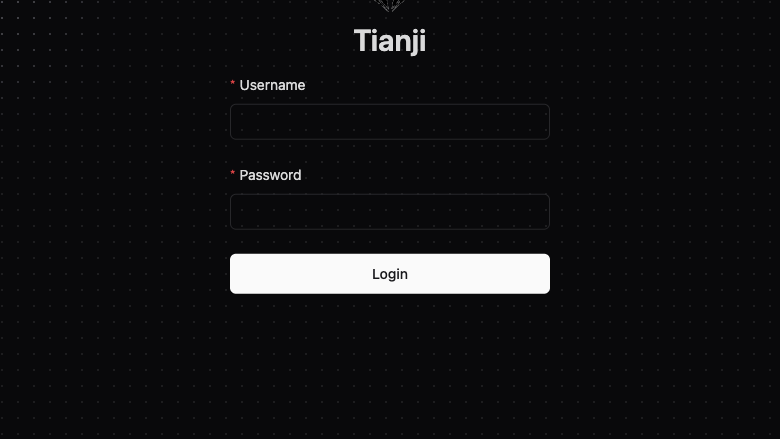
The Tianji sign-in, served on first boot with a per-instance administrator login.
Step 5: The Dashboard
After signing in you land on the dashboard. The left navigation gives you Website analytics, Monitors, Servers and Telemetry, status Pages, Surveys, Feeds and more. The image seeds a demo website so the workspace is populated the moment you sign in - you can rename or delete it and add your own.
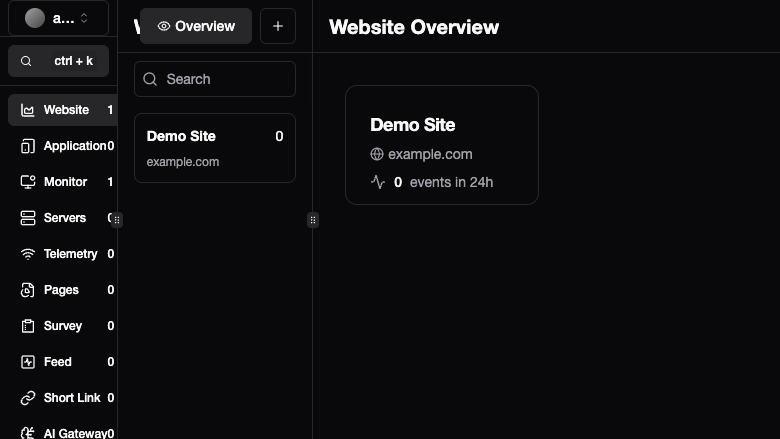
The Tianji website analytics overview, showing the seeded demo website.
Step 6: Add a Website for Analytics
Select Website then Add, give the site a name and its domain, and create it. Tianji generates a small privacy-friendly tracking script. Add that script to the pages you want to measure, and page views, visitors, referrers and events start appearing on the overview. Analytics are stored in PostgreSQL - no third-party tracker and no external analytics service are involved.
Step 7: Add an Uptime Monitor and a Status Page
Select Monitor then Add to create an HTTP, TCP or ping monitor for any endpoint. Tianji checks it on the interval you set, records response time and uptime, and can alert you through notification channels when it goes down. The image seeds a health monitor so you can see a working monitor immediately.
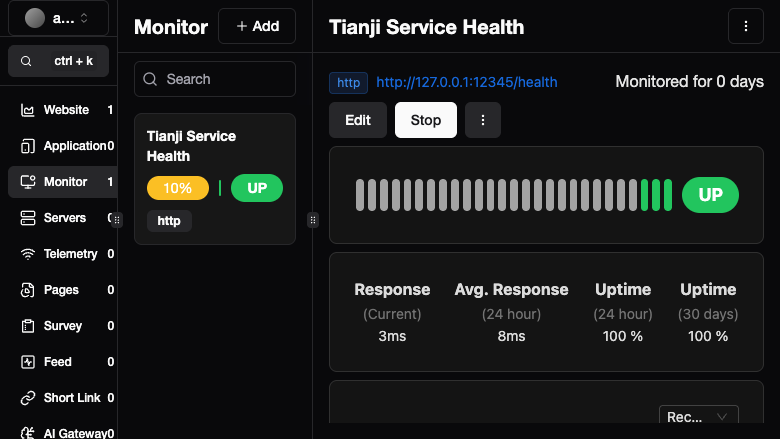
A Tianji uptime monitor reporting UP, with response time and uptime history.
Publish a public status page under Pages to show the health of your monitors to your users, and add notification channels (email, webhook and many others through Apprise) so outages reach you.
Step 8: Server Telemetry (optional)
Tianji can collect status and metrics from your servers. A reporter agent on a remote host pushes metrics to this instance over UDP port 12345. If you use this feature, open UDP 12345 in the security group from the reporting hosts only, then follow the reporter instructions under Servers in the dashboard:
# On the remote server you want to report from (open UDP 12345 to this instance first):
# follow the reporter command shown under Servers in the Tianji dashboard, pointing it at
# http://<public-ip>/ as the Tianji server URL.
Step 9: Enable HTTPS with Let's Encrypt
For any production deployment serve Tianji over HTTPS so logins cannot be intercepted. The image ships with nginx, which certbot can configure automatically. The following assumes a DNS record pointing your fully qualified domain name at the instance's public IP address.
sudo apt-get update && sudo apt-get install -y certbot python3-certbot-nginx
sudo certbot --nginx -d tianji.your-domain.example \
  --non-interactive --agree-tos -m you@your-domain.example \
  --redirect
Tianji derives its dashboard URLs from the request Host header, so once certbot has added the HTTPS server block Tianji serves correctly on your domain with no further configuration.
Step 10: Backups and Maintenance
Tianji keeps all state - accounts, websites, analytics, monitors and telemetry - in PostgreSQL. Back it up regularly:
sudo -u postgres pg_dump tianji > <backup-dir>/tianji-db-$(date +%F).sql
Because the database is on its own EBS volume mounted at /var/lib/postgresql and the application tree is on its own volume at /opt/tianji, you can also take coordinated EBS snapshots. The services are managed by systemd:
systemctl is-active tianji nginx postgresql
To upgrade Tianji, follow the upstream release notes at https://tianji.msgbyte.com/ - the application tree lives under /opt/tianji/src.
Step 11: Scaling and Operations
- Move PostgreSQL to Amazon RDS for PostgreSQL and update
DATABASE_URLin/etc/tianji/tianji.env, then restarttianji. - Put the web tier behind an Application Load Balancer with an ACM certificate for managed HTTPS and high availability.
- Grow either EBS data volume and expand the filesystem online as your analytics and telemetry history grows.
Support
cloudimg provides 24/7/365 expert technical support for this image. Guaranteed response within 24 hours, one hour average for critical issues. Contact support@cloudimg.co.uk.
For general Tianji questions consult the documentation at https://tianji.msgbyte.com/. Tianji is a trademark of its respective owner; use here is nominative and does not imply affiliation or endorsement.