Uptime Kuma on AWS User Guide
Uptime Kuma on AWS
This image delivers Uptime Kuma 1.23, the popular open source self-hosted uptime and status monitor, fully installed and reverse-proxied with nginx. Uptime Kuma watches HTTP(S), TCP, ping, DNS, push, Docker, gRPC and other endpoints, sends alerts through more than ninety notification integrations, publishes public status pages, and tracks response times and TLS certificate expiry.
The Uptime Kuma server runs as a Node.js application under systemd, listening on the loopback interface, with nginx in front on port 80 (and 443 once you add TLS). nginx is configured to proxy the WebSocket traffic that the real-time dashboard relies on. The database (an embedded SQLite file) and uploads live on a dedicated, independently-resizable EBS data volume mounted at /var/lib/uptime-kuma, separate from the operating system disk.
Secure by default - you create the administrator
Uptime Kuma has no default administrator, and this image does not bake one in. The AMI ships at Uptime Kuma's built-in first-run setup wizard. The very first time you browse to your instance you create your own administrator username and password. No shared credentials, and no database rows, ship in the image - every instance starts as a clean slate that only you secure.
Connecting to your instance
Connect over SSH on port 22 using the default login user for your operating system variant and the EC2 key pair you launched with.
| OS variant | SSH login user | Example |
|---|---|---|
| Ubuntu 24.04 | ubuntu |
ssh -i your-key.pem ubuntu@<instance-public-ip> |
Replace <instance-public-ip> with your instance's public IPv4 address (or its private address if you reach it over a VPN or Direct Connect).
First visit - create your administrator
Open the dashboard in your browser:
http://<instance-public-ip>/
You are taken to the Create your admin account setup wizard. Choose a language, enter a username, choose a strong password, confirm it and click Create.
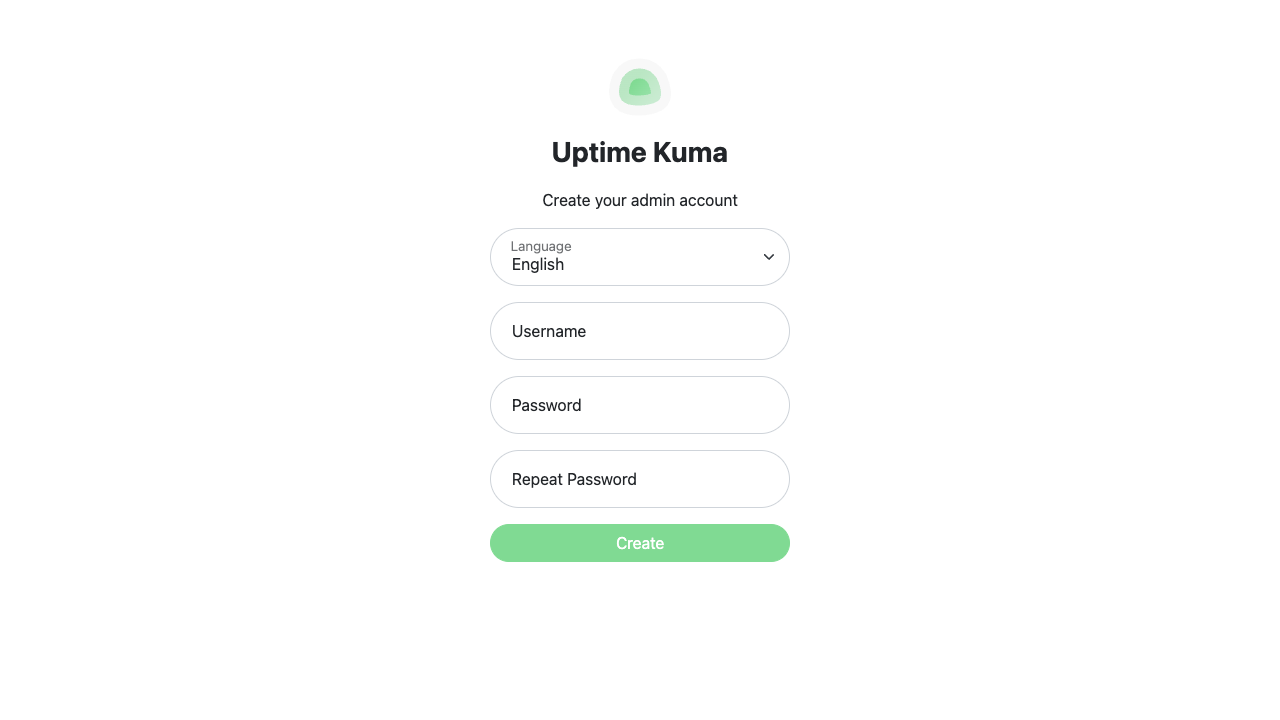
That single step secures your instance. You are signed straight into the dashboard, and the setup wizard will never appear again for this instance.
Enable HTTPS before exposing the instance to the public internet (see the TLS section below). Until then, treat the password you set here as you would any credential sent over plain HTTP.
Adding your first monitor
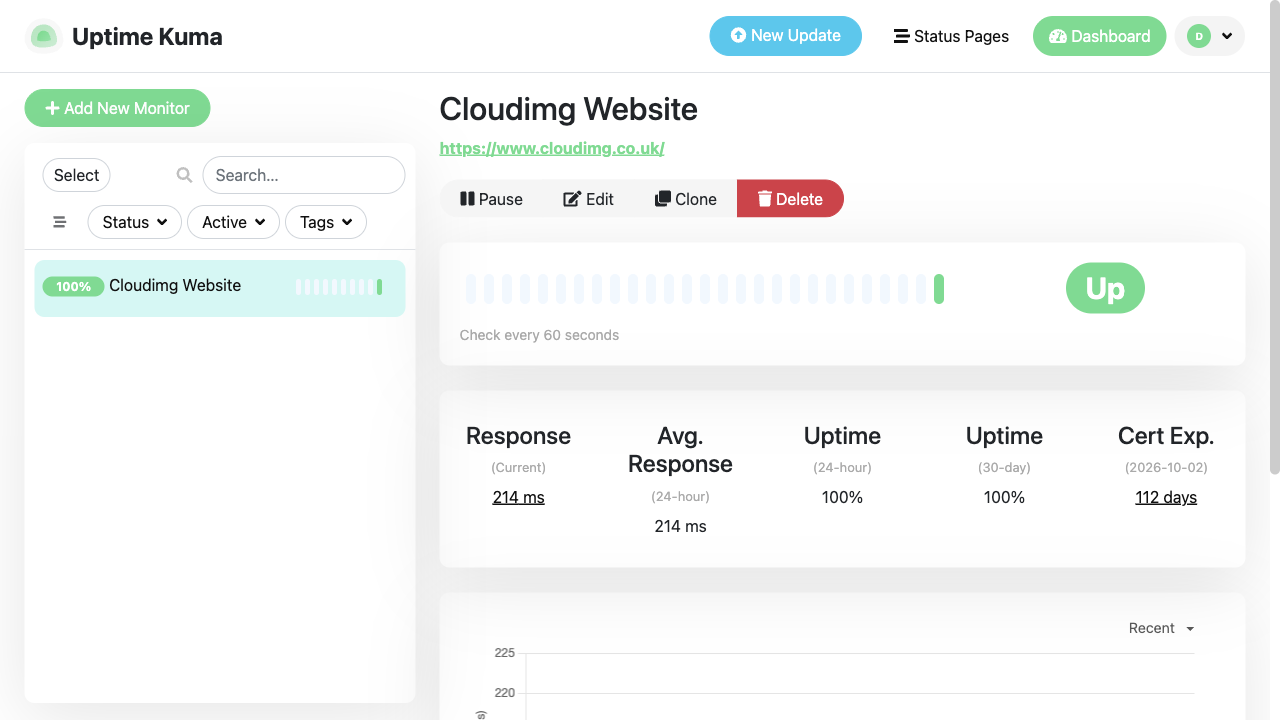
From the dashboard, click Add New Monitor. Choose a Monitor Type (HTTP(s), TCP Port, Ping, DNS, Docker, a database probe and many more), give it a Friendly Name, enter the target URL or host, and tune the heartbeat interval, retries and accepted status codes if you wish. Click Save.
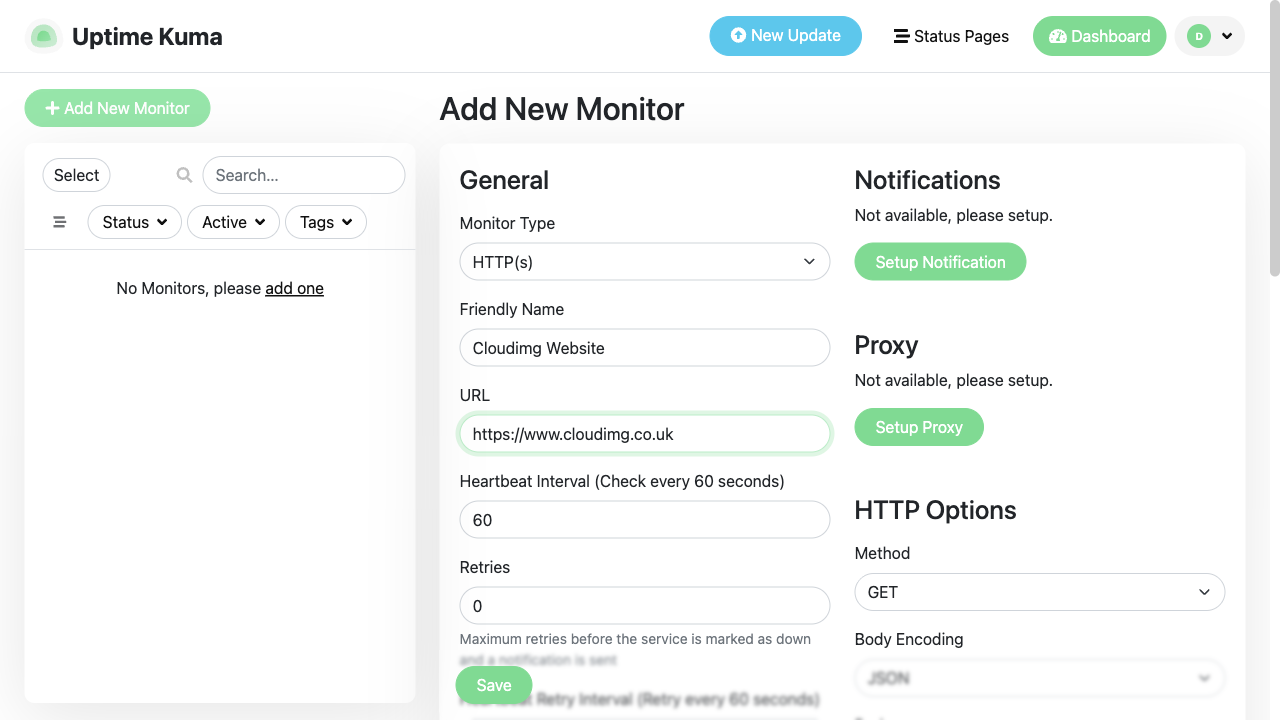
Uptime Kuma immediately begins probing the target and the monitor appears in the sidebar with a live status. Each monitor's detail page shows its current and average response time, 24-hour and 30-day uptime, certificate expiry for HTTPS targets, and a real-time response-time chart.
Notifications and status pages
- Notifications: open Settings -> Notifications (or Setup Notification from a monitor) to wire up any of the ninety-plus integrations - email/SMTP, Slack, Discord, Telegram, webhooks, PagerDuty and more - then attach them to your monitors.
- Status pages: click Status Pages -> New Status Page to publish a public or private page showing the health of a chosen set of monitors, with your own logo, title and incident messages.
Managing the services
The stack is two systemd units. On Ubuntu 24.04:
# Check status
sudo systemctl status uptime-kuma nginx

# Restart the application or the reverse proxy
sudo systemctl restart uptime-kuma
sudo systemctl restart nginx
The Uptime Kuma server listens on 127.0.0.1:3001 and nginx serves it on port 80:
sudo ss -tlnp | grep -E ':80 |:3001 '
LISTEN 0 511 127.0.0.1:3001 0.0.0.0:* users:(("node",pid=6346,fd=21))
LISTEN 0 511 0.0.0.0:80     0.0.0.0:* users:(("nginx",...))
The data volume
Uptime Kuma's SQLite database (kuma.db), configuration and uploads live on a dedicated EBS volume mounted at /var/lib/uptime-kuma, which is independently resizable and kept separate from the OS disk:
df -h /var/lib/uptime-kuma
Filesystem      Size  Used Avail Use% Mounted on
/dev/nvme1n1     30G  ...        ...% /var/lib/uptime-kuma
The volume is mounted by its filesystem UUID in /etc/fstab, so the mount is stable across reboots and instance re-launches. To grow it, resize the EBS volume in the AWS console, then run sudo resize2fs /dev/nvme1n1 (substitute the device shown by lsblk). Back up /var/lib/uptime-kuma (or snapshot the EBS volume) to protect your monitoring history and configuration.
Enabling HTTPS with Let's Encrypt
For production use, terminate TLS at nginx. Point a DNS A record at the instance's public IP, then install certbot and obtain a certificate. Replace the placeholders with your own domain and email:
sudo apt-get update
sudo apt-get install -y certbot python3-certbot-nginx
Run certbot interactively and follow its prompts (it edits the nginx site for you):
sudo certbot --nginx -d your-domain.example.com -m you@example.com --agree-tos
certbot configures the HTTPS server block and sets up automatic renewal. After it completes, your dashboard is available at https://your-domain.example.com/. Make sure your security group allows inbound TCP 443.
Upgrading Uptime Kuma
Uptime Kuma is installed from source under /opt/uptime-kuma. To upgrade within the 1.x line, fetch the desired tag and rebuild the production install as the application user, then restart the service. Always snapshot the data volume first. cloudimg support can assist with planning and performing upgrades.
Support
This Amazon Machine Image is provided by cloudimg with 24/7 technical support covering deployment, upgrades, integrations, TLS termination and notification setup. Contact us through your AWS Marketplace seller support channel.
Uptime Kuma is a trademark of its respective owner. All product and company names are trademarks or registered trademarks of their respective holders. Use of them does not imply any affiliation with or endorsement by them.