VictoriaMetrics on AWS User Guide
Overview
This image runs VictoriaMetrics, the fast, cost effective and scalable open source time series database and monitoring solution. VictoriaMetrics is a drop in replacement for Prometheus remote storage and accepts metrics over the Prometheus remote write protocol, the Influx line protocol, Graphite, OpenTSDB and its own JSON and CSV import APIs. It answers queries in MetricsQL, a backwards compatible superset of PromQL.
The VictoriaMetrics single node binary is installed under /opt/victoriametrics and runs as a dedicated unprivileged victoriametrics system account under a systemd service that starts it on boot and restarts it on failure. The time series database lives at /var/lib/victoria-metrics, which is a dedicated, independently resizable EBS data volume.
VictoriaMetrics ships with no built in authentication, so the database binary binds to the loopback interface only and is never exposed directly. An nginx reverse proxy publishes the vmui web interface and the Prometheus compatible read and write APIs on port 80 behind HTTP Basic authentication. The admin password is generated on the first boot of every deployed instance, so two instances launched from the same Amazon Machine Image never share a password. It is written to /root/victoriametrics-credentials.txt with mode 0600 so that only the root user can read it.
Prerequisites
Before you deploy this image you need:
- An Amazon Web Services account where you can launch EC2 instances
- IAM permissions to launch instances, create security groups, and subscribe to AWS Marketplace products
- An EC2 key pair in the target Region for SSH access to the instance
- A VPC and subnet in the target Region, with a security group allowing inbound port 22 from your management network and port 80 for the vmui interface and the read and write APIs
- The AWS CLI (version 2) installed locally if you plan to deploy from the command line
Step 1: Launch the Instance from the AWS Marketplace
Sign in to the AWS Management Console, open the EC2 service, and select Launch instance. Under Application and OS Images choose AWS Marketplace AMIs and search for VictoriaMetrics. Select the cloudimg listing and choose Select, then Continue on the subscription summary.
Pick an instance type of t3.large or larger. Choose your EC2 key pair under Key pair (login). Under Network settings select your VPC and subnet, and either create or select a security group that opens port 22 from your management network and port 80 for the vmui interface and the APIs. Leave the root volume at the default size or larger.
Select Launch instance. First boot initialisation takes a few seconds after the instance state becomes Running and the status checks pass.
Step 2: Launch the Instance from the AWS CLI
The following block launches an instance from the cloudimg VictoriaMetrics Marketplace AMI into an existing subnet and security group. Replace <ami-id> with the AMI ID shown on the Marketplace listing, <key-name> with your EC2 key pair name, <subnet-id> with your subnet ID, and <security-group-id> with a security group that opens ports 22 and 80 as described above.
aws ec2 run-instances \
  --image-id <ami-id> \
  --instance-type t3.large \
  --key-name <key-name> \
  --subnet-id <subnet-id> \
  --security-group-ids <security-group-id> \
  --tag-specifications 'ResourceType=instance,Tags=[{Key=Name,Value=victoriametrics}]'
When the instance reaches the Running state and its status checks pass, note its public IP address or DNS name from the EC2 console or with aws ec2 describe-instances.
Step 3: Connect to Your Instance
Connect over SSH using your key pair and the login user for your operating system variant.
| OS variant | SSH login user |
|---|---|
| Ubuntu 24.04 | ubuntu |
ssh -i <key-name>.pem ubuntu@<public-ip>
Step 4: Retrieve the Admin Password
The vmui admin password is unique to your instance and was generated on first boot. Read it as root:
sudo cat /root/victoriametrics-credentials.txt
The file lists the vmui URL, the admin user (admin) and the generated password, along with the ingestion endpoint URLs. Keep this password somewhere safe.
Step 5: Sign In to the vmui Web Interface
The vmui web interface is served on port 80 by nginx behind HTTP Basic authentication. In a browser, go to:
http://<instance-public-ip>/
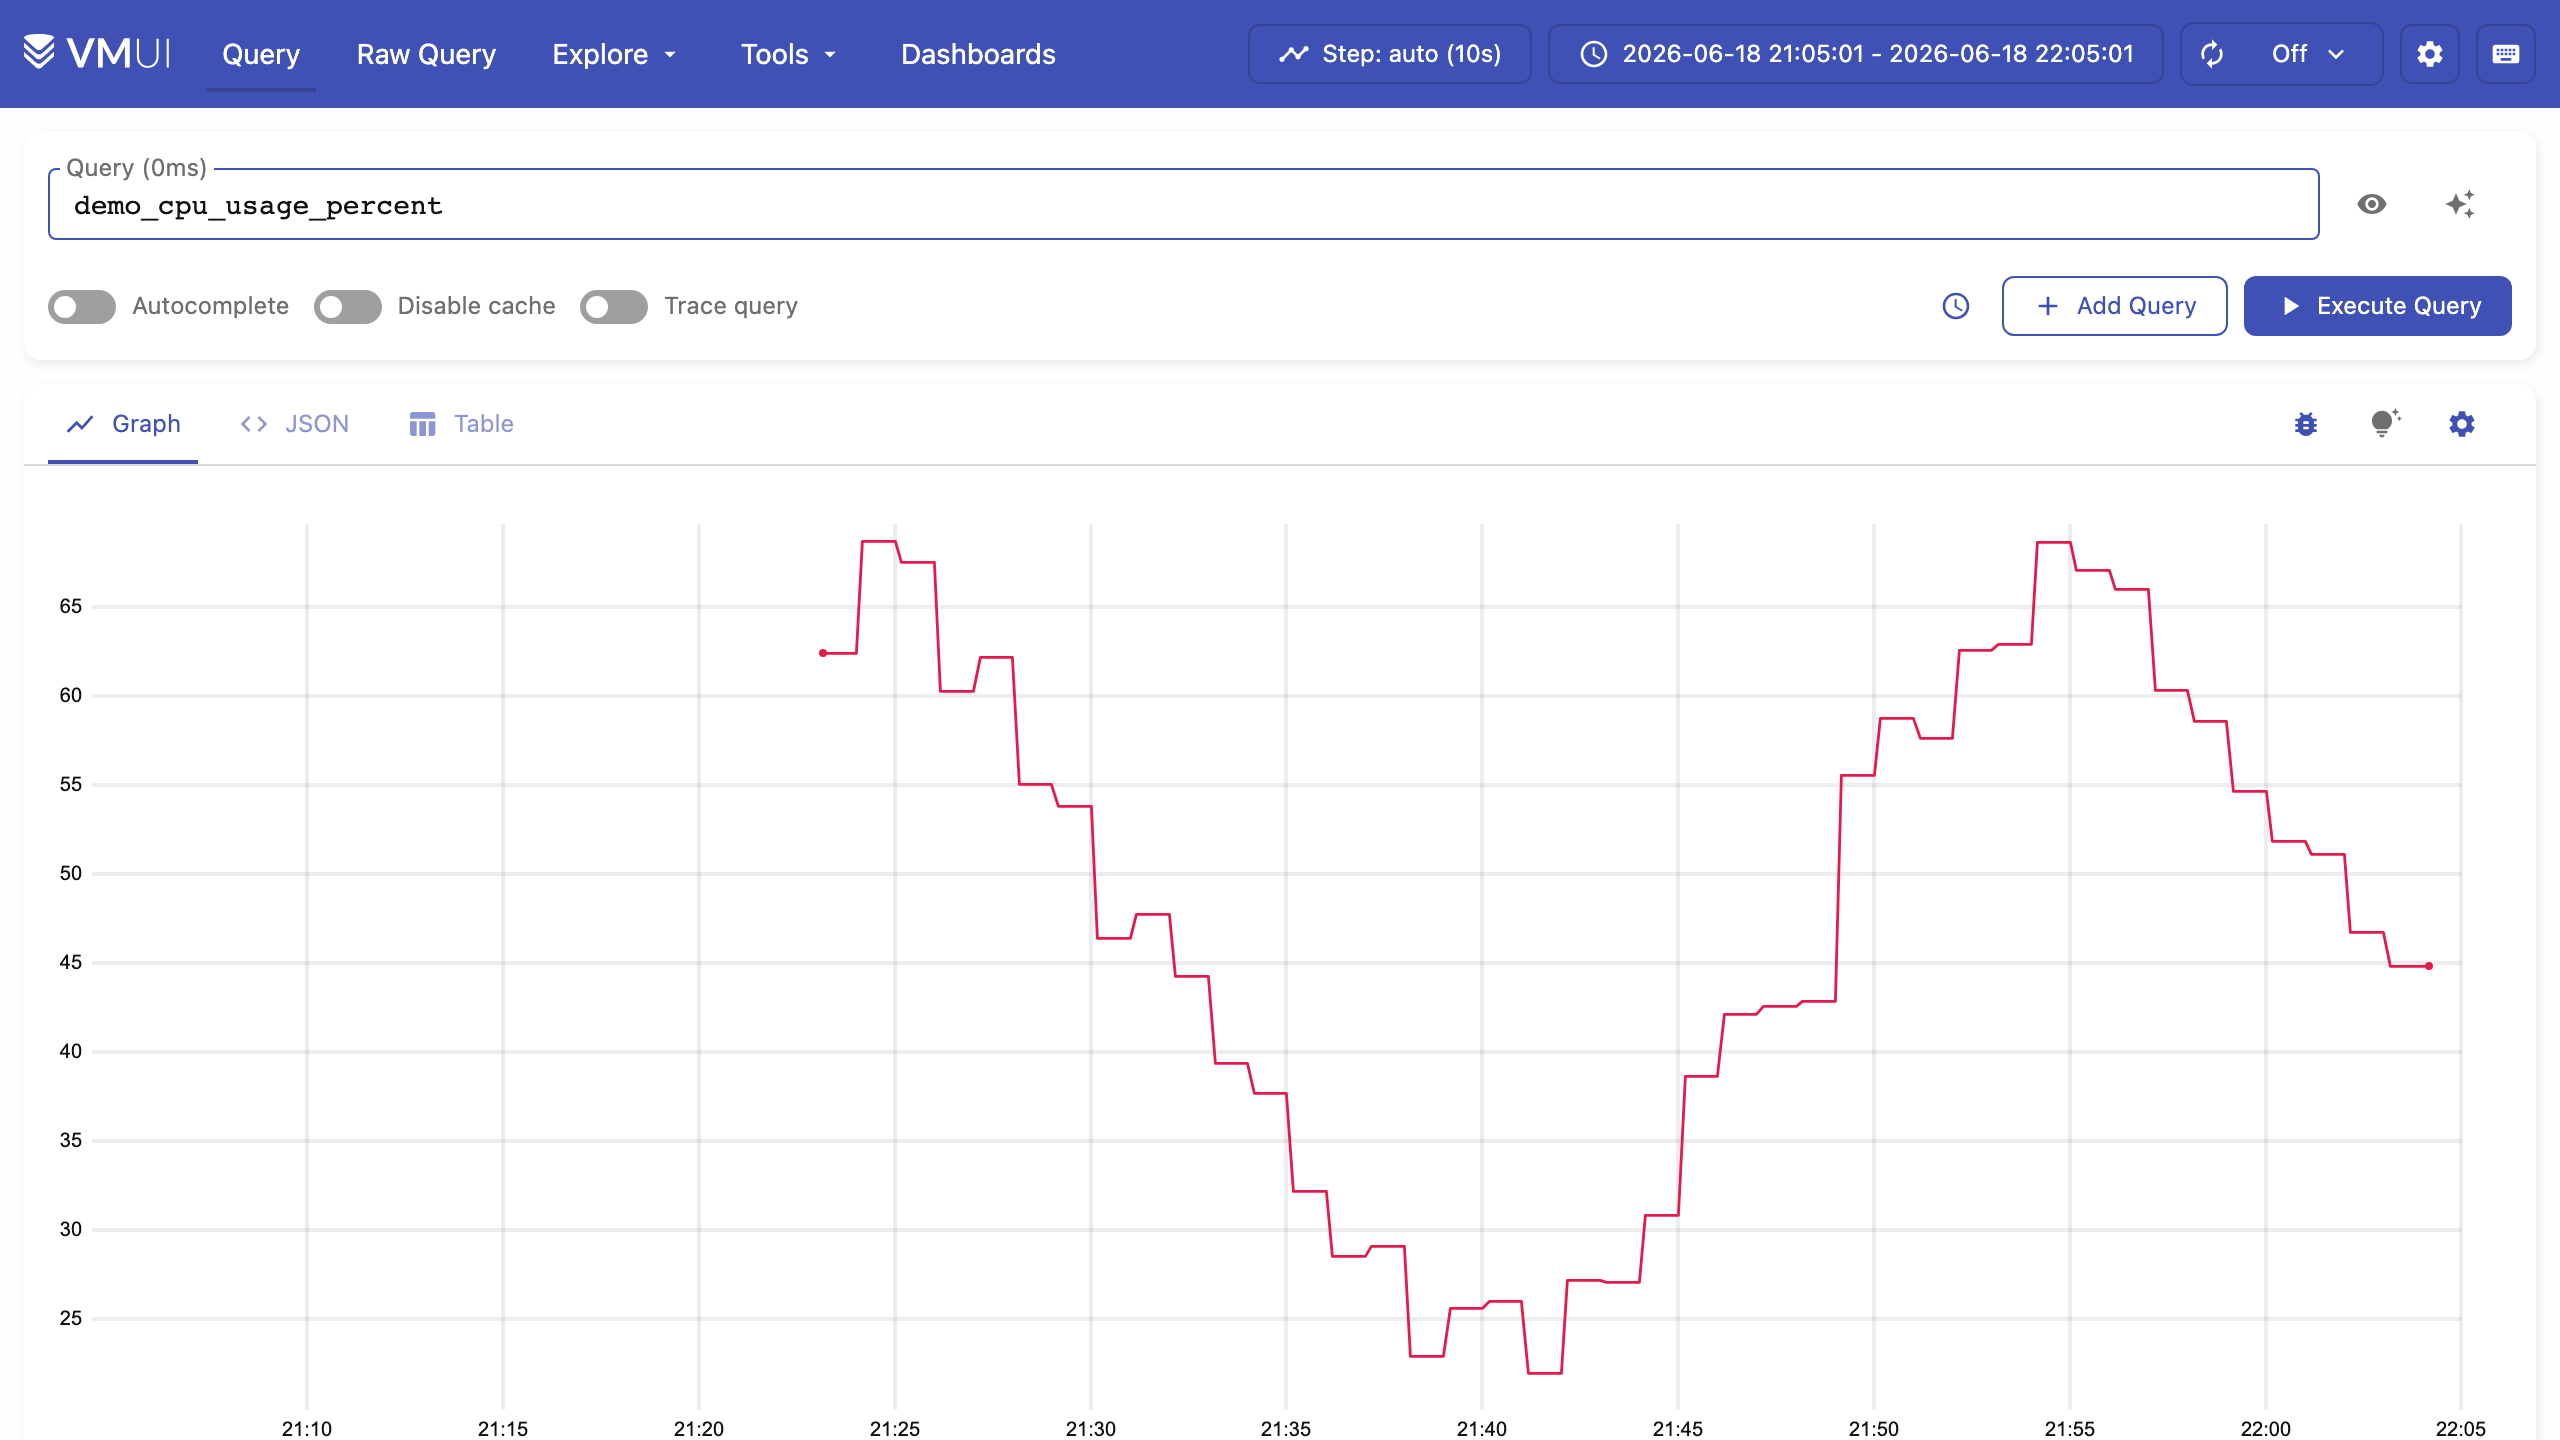
You are prompted for credentials. Sign in as admin with the password from the credentials file. The bare root redirects to the vmui query interface, where you can enter a MetricsQL or PromQL expression and graph the result.
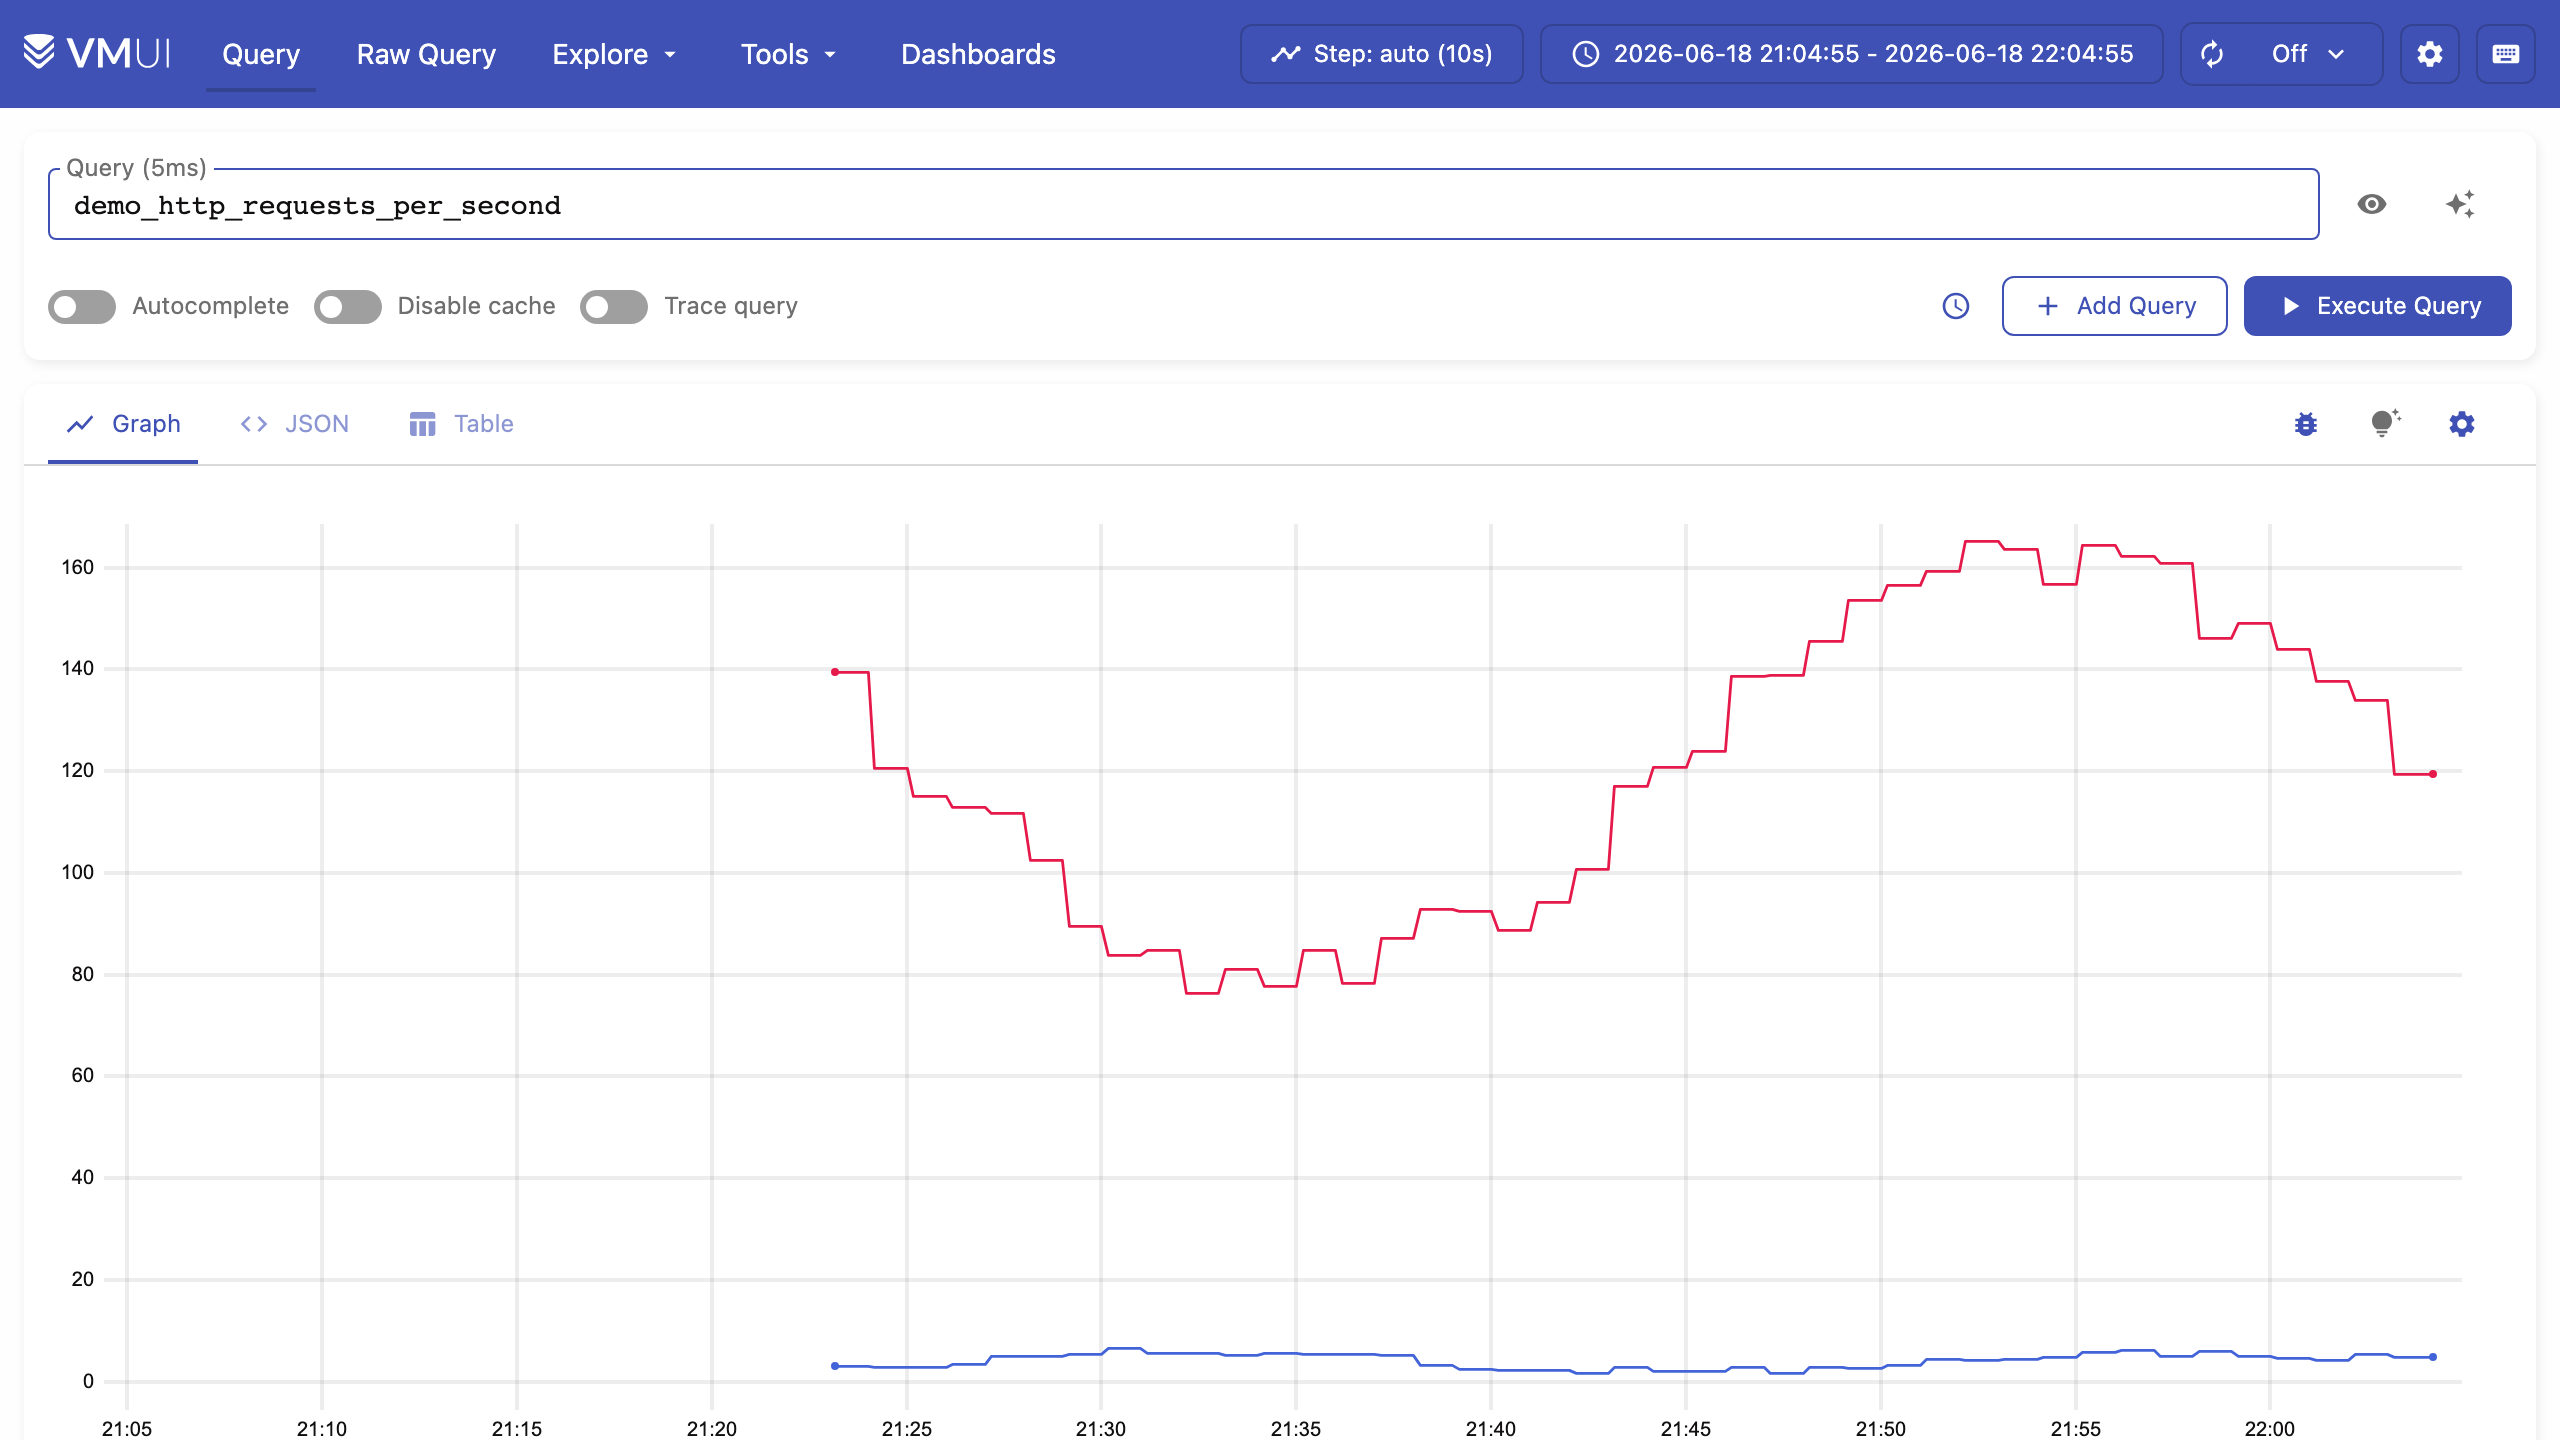
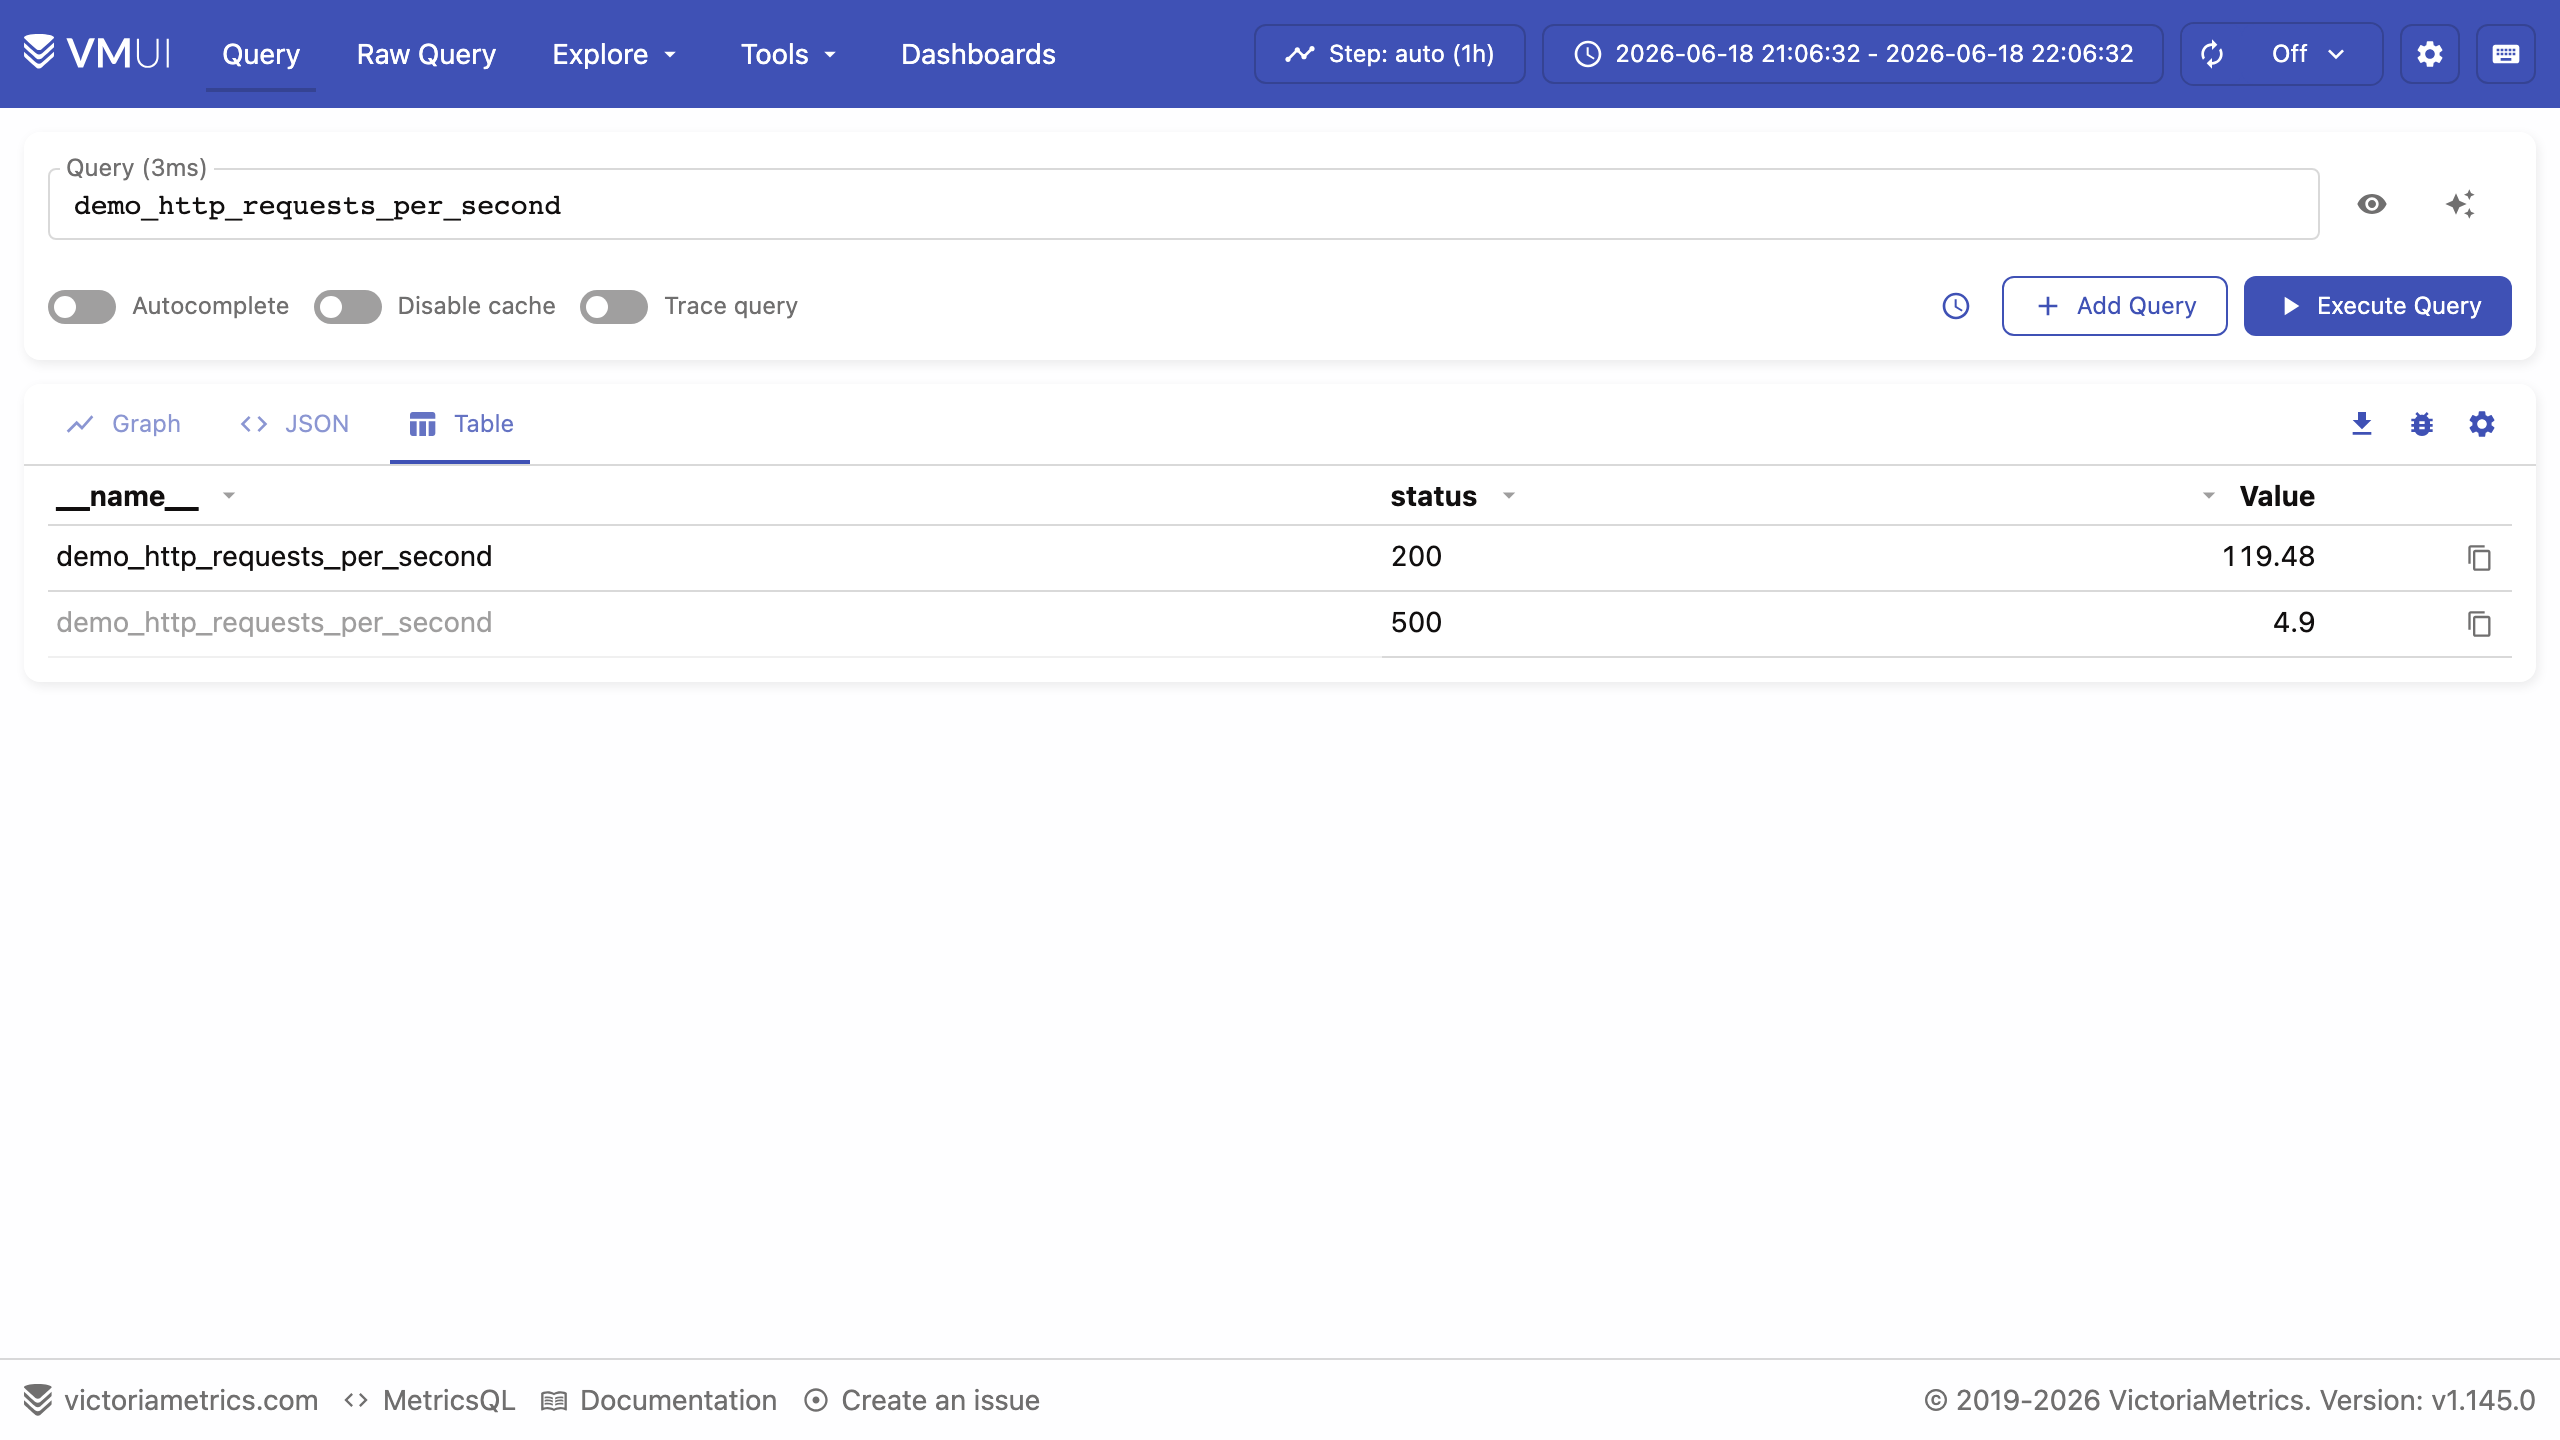
vmui graphs every matching time series. Switch the time range with the range picker, add more queries with Add Query, and toggle between the Graph, JSON and Table result views.
The Table view lists the instant value of every series returned by the query, which is useful for inspecting labels and current values.
Step 6: Confirm VictoriaMetrics Is Running
Over SSH, confirm the database and the nginx proxy are active and that the ports are listening:
sudo systemctl is-active victoriametrics nginx
sudo ss -tlnp | grep -E ':(80|8428) '
You should see both services reported as active, the database listening on 127.0.0.1:8428 (loopback only), and nginx listening on port 80.
Step 7: Ingest Metrics
VictoriaMetrics accepts metrics over several protocols on port 80 through the authenticating proxy. Point your existing agents at the instance using the admin credentials:
- Prometheus remote write — set the
remote_writeURL in your Prometheus or vmagent config tohttp://<instance-public-ip>/api/v1/writewith basic auth useradmin. - Influx line protocol — send to
http://<instance-public-ip>/influx/write. - Graphite and OpenTSDB — enable the corresponding listeners as described in the VictoriaMetrics documentation.
- Import APIs — push JSON, CSV or Prometheus exposition format to
http://<instance-public-ip>/api/v1/importand related endpoints.
The database also exposes its own internal metrics. List the metric names currently stored with a loopback query on the instance:
curl -s http://127.0.0.1:8428/api/v1/label/__name__/values
Step 8: Query with MetricsQL and the HTTP API
Query VictoriaMetrics through the vmui interface, your Grafana dashboards, or the Prometheus compatible HTTP API. Instant queries go to /api/v1/query and range queries to /api/v1/query_range. On the instance you can query over loopback without credentials:
curl -s 'http://127.0.0.1:8428/api/v1/query?query=vm_rows' | head -c 400; echo
From outside the instance, send the same request to http://<instance-public-ip>/api/v1/query with basic auth user admin and the generated password.
Step 9: Connect Grafana
Add VictoriaMetrics to Grafana as a Prometheus data source. Set the URL to http://<instance-public-ip>/, enable Basic auth, and enter user admin with the generated password. VictoriaMetrics answers the Prometheus query API, so existing Prometheus dashboards work unchanged, and you can additionally use MetricsQL extensions in your panels.
Step 10: The Data Volume
The time series database lives on a dedicated EBS volume mounted at /var/lib/victoria-metrics. This keeps the metrics store off the operating system disk and lets you resize or snapshot it independently. Confirm the mount with:
df -h /var/lib/victoria-metrics
To grow the metrics store, expand the EBS volume in the AWS console, then grow the filesystem on the instance with sudo resize2fs on the underlying device. Retention is set to 12 months by default and can be changed with the -retentionPeriod flag in the victoriametrics.service unit.
Step 11: Enable HTTPS
The vmui interface and APIs are served over plain HTTP on port 80 by nginx. For production use, place them behind TLS. Obtain a certificate for your domain (for example with a managed certificate on an Application Load Balancer in front of the instance, or with Certbot installed on the instance), then configure nginx to listen on 443 with your certificate and proxy to 127.0.0.1:8428 exactly as the bundled site does for port 80, keeping the HTTP Basic authentication in place. Restrict the security group so port 80 and 443 are reachable only from the networks that ingest and query metrics.
Step 12: Backup and Maintenance
Back up the database by snapshotting the /var/lib/victoria-metrics EBS volume, which captures the entire time series store. VictoriaMetrics also supports consistent backups with the vmbackup tool. Apply operating system security updates with sudo apt-get update && sudo apt-get upgrade and reboot when a new kernel is installed; VictoriaMetrics and nginx start automatically on boot.
Support
This image is published and supported by cloudimg. Support covers deployment, ingestion protocol configuration, retention and downsampling, MetricsQL queries, Grafana integration, TLS and storage tuning. Contact cloudimg through the support channel listed on the AWS Marketplace listing.
All product and company names are trademarks or registered trademarks of their respective holders. Use of them does not imply any affiliation with or endorsement by them.