VictoriaMetrics on Ubuntu 24.04 on Azure User Guide
Overview
VictoriaMetrics is the fast, cost-effective and scalable open-source time-series database and monitoring solution. It is a drop-in Prometheus replacement for long-term metrics storage: it speaks PromQL and the extended MetricsQL, ingests via Prometheus remote-write, InfluxDB, Graphite and OpenTSDB protocols, and uses a fraction of the RAM and disk of comparable systems. The cloudimg image installs VictoriaMetrics single-node 1.145.0 at /opt/victoriametrics, runs it as a dedicated victoriametrics system user, binds it to loopback behind an nginx reverse proxy on TCP 80 with HTTP Basic auth, persists all time-series data on a dedicated Azure data disk, and generates a unique web password on the first boot of every VM. The image also self-scrapes its own metrics so the database is useful the moment it boots. Backed by 24/7 cloudimg support.
What is included:
- VictoriaMetrics single-node 1.145.0 at
/opt/victoriametrics - The vmui web UI and the Prometheus-compatible query and ingest API, fronted by nginx on
:80 - nginx HTTP Basic auth (VictoriaMetrics single-node has no built-in authentication) with a per-VM password in a root-only file
- A dedicated Azure data disk at
/var/lib/victoria-metricsholding all time-series data — separate from the OS disk and re-provisioned with every VM - Built-in self-monitoring (
-selfScrapeInterval) so the database has live metrics from first boot victoriametrics.service+nginx.serviceas systemd units, enabled and active- 24/7 cloudimg support
Prerequisites
An active Azure subscription, an SSH key pair, and a VNet + subnet in the target region. Standard_B2ms (2 vCPU / 8 GiB RAM) is a good starting point; scale up for higher ingestion rates and cardinality. NSG inbound: allow 22/tcp from your management network and 80/tcp for the web UI and API (front with TLS for public exposure — see Enabling HTTPS).
Step 1 — Deploy from the Azure Marketplace
Sign in to the Azure Portal, choose Create a resource, search the Marketplace for VictoriaMetrics by cloudimg, and select Create. On Basics pick your subscription, resource group, region and size; under Administrator account choose SSH public key and paste your key; under Inbound port rules allow SSH (22) and HTTP (80). Review the dedicated data disk on the Disks tab, then Review + create → Create.
Step 2 — Deploy from the Azure CLI
az vm create \
  --resource-group <your-rg> \
  --name victoriametrics \
  --image <marketplace-image-urn> \
  --size Standard_B2ms \
  --admin-username azureuser \
  --ssh-key-values ~/.ssh/id_ed25519.pub \
  --vnet-name <your-vnet> --subnet <your-subnet> \
  --public-ip-sku Standard

az vm open-port --resource-group <your-rg> --name victoriametrics --port 80 --priority 1010
Step 3 — Connect to your VM
ssh azureuser@<vm-public-ip>
Step 4 — Confirm the services are running
systemctl is-active victoriametrics.service nginx.service
Both services report active. VictoriaMetrics starts in seconds and begins self-scraping its own metrics immediately.
Step 5 — Retrieve your web password
The admin password is generated uniquely on the first boot of your VM and written to a root-only file:
sudo cat /root/victoriametrics-credentials.txt
This file contains VICTORIAMETRICS_ADMIN_USER (admin) and VICTORIAMETRICS_ADMIN_PASSWORD, plus the URLs for the web UI and API. Store the password somewhere safe.
Step 6 — Check the health endpoint
nginx serves an unauthenticated health endpoint for load balancers and probes:
curl -s http://localhost/health
It returns ok.
Step 7 — Open the vmui web UI
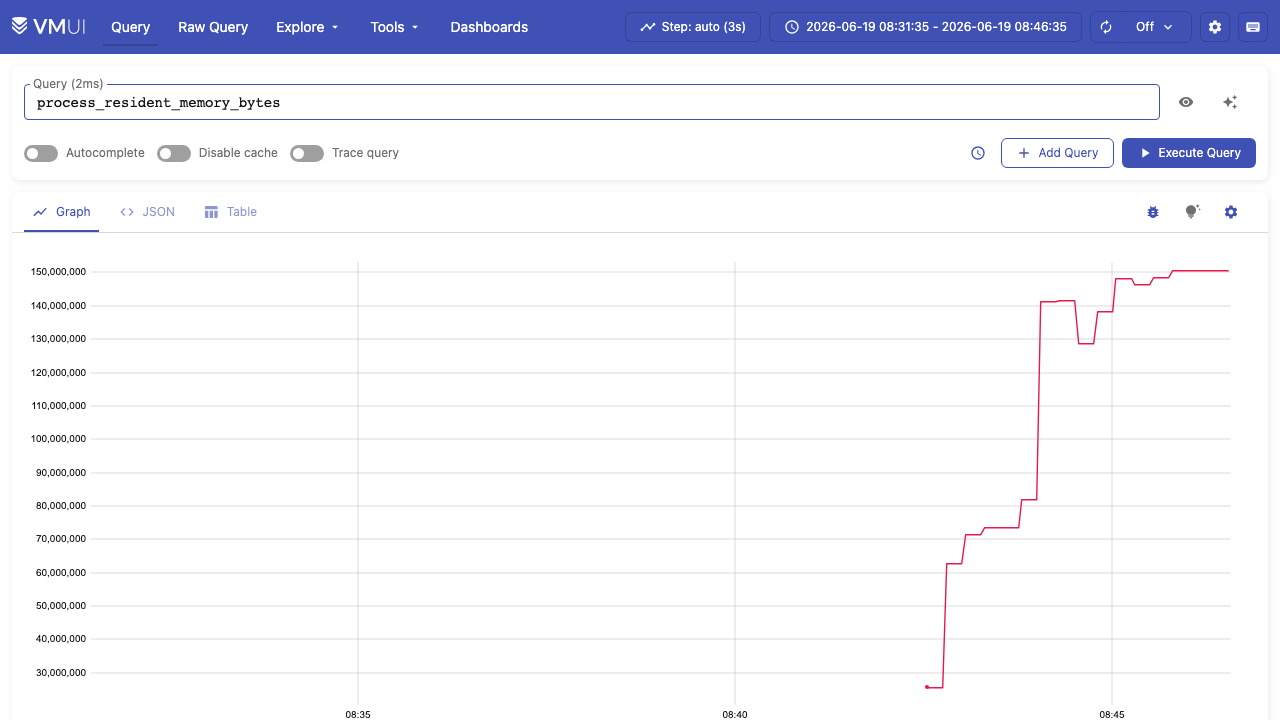
Browse to http://<vm-public-ip>/vmui/ and sign in as admin with the password from Step 5. vmui is the built-in query interface: enter a PromQL/MetricsQL expression and run it as a graph, JSON or table. The image self-scrapes its own internals, so you can immediately graph metrics such as process_resident_memory_bytes or vm_rows.
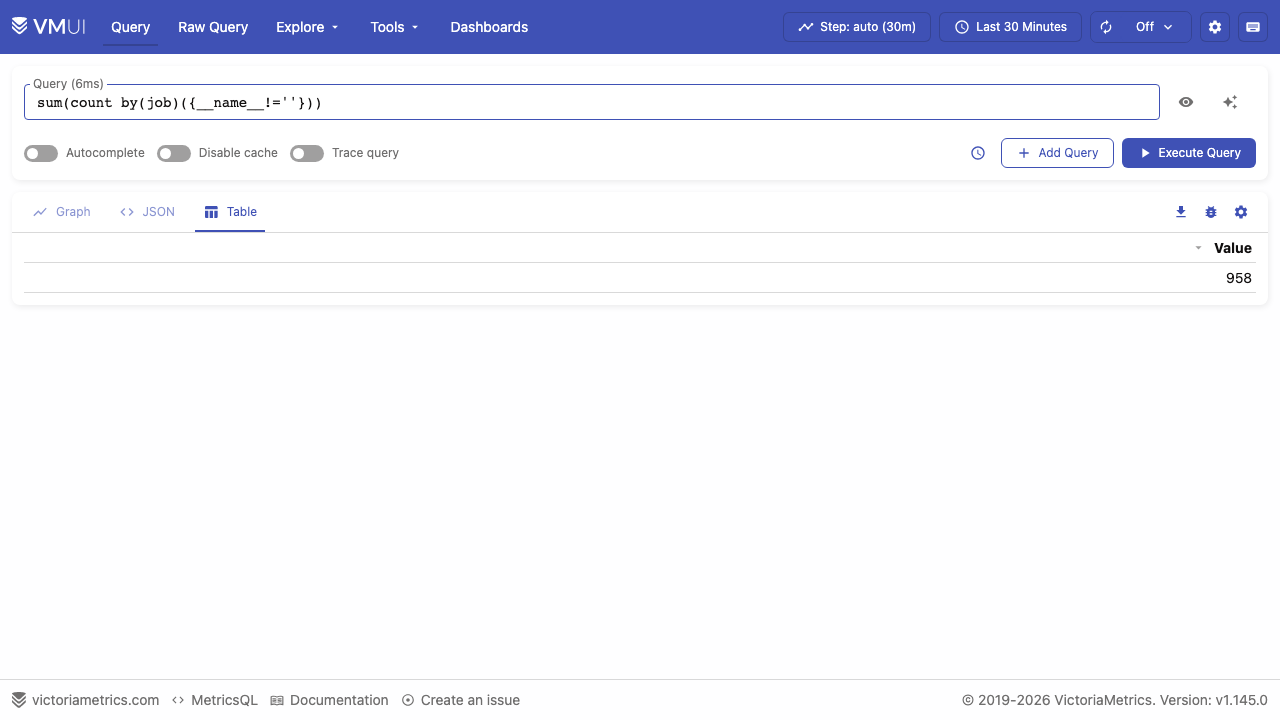
The Table tab shows the instant value of each series returned by your query:
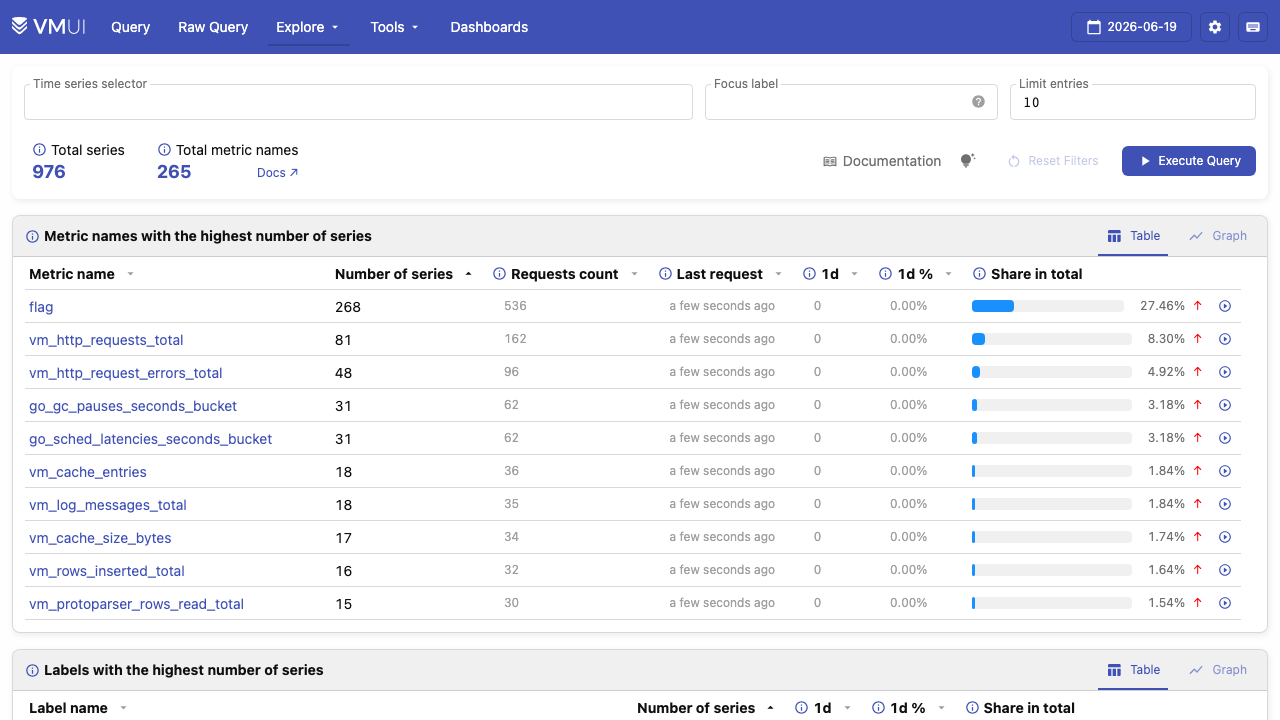
The Explore → Cardinality tool helps you find which metrics and label values consume the most storage:
Step 8 — Query from the command line
The Prometheus-compatible query API is available behind the same Basic auth. Confirm VictoriaMetrics is serving and report its build version:
curl -s -u admin:<VICTORIAMETRICS_ADMIN_PASSWORD> 'http://localhost/api/v1/query?query=vm_app_version' | head -c 300; echo
You get a JSON response with "status":"success" and a vm_app_version series carrying the running version label.
Step 9 — Ingest your own metrics
VictoriaMetrics accepts Prometheus remote-write at /api/v1/write and also a simple line-import endpoint. Push a sample data point with the Prometheus import API (it is accepted immediately and becomes queryable within a few seconds), then query the total number of active time series the database is tracking:
printf 'example_metric{source="guide"} 42\n' | curl -s -u admin:<VICTORIAMETRICS_ADMIN_PASSWORD> -H 'Content-Type: text/plain' --data-binary @- http://localhost/api/v1/import/prometheus
curl -s -u admin:<VICTORIAMETRICS_ADMIN_PASSWORD> 'http://localhost/api/v1/query?query=count(%7B__name__!=%22%22%7D)' | head -c 300; echo
The count query returns a "status":"success" response with the number of active series — already populated by the image's built-in self-monitoring. Point Prometheus, Telegraf, Grafana Agent or any remote-write client at http://<vm-public-ip>/api/v1/write (with the Basic-auth credentials) to ship real metrics, and add VictoriaMetrics as a Prometheus data source in Grafana using the same URL.
Step 10 — Confirm data lives on the dedicated disk
All time-series data is stored on the dedicated Azure data disk so it survives OS changes and can be resized independently:
findmnt /var/lib/victoria-metrics
The mount is backed by a separate Azure data disk captured into the image and re-provisioned on every VM.
Enabling HTTPS
The nginx reverse proxy terminates plain HTTP on port 80. For public exposure, put a certificate in front of it. The simplest path is to add a DNS name for the VM and use the companion cloudimg nginx-ssl-certbot image as a TLS reverse proxy, or install certbot and extend the existing nginx site with a listen 443 ssl; server block and your certificate paths. Keep VictoriaMetrics itself bound to loopback so the only public surface is the authenticated, TLS-terminated proxy.
Maintenance
- Retention: the image keeps 12 months of data by default (
-retentionPeriod=12). Adjust it in/etc/default/victoriametrics(theVM_ARGSline) andsudo systemctl restart victoriametrics. - Backups: snapshot the
/var/lib/victoria-metricsdata disk, or usevmbackupfor incremental backups to Azure Blob Storage. - Upgrades: replace the
/opt/victoriametrics/victoria-metrics-prodbinary with a newer release and restart the service; the on-disk data format is forward-compatible. - Security patches: unattended-upgrades remains enabled so the OS continues to receive security updates automatically.
Support
cloudimg provides 24/7 expert support for this image. Contact support@cloudimg.co.uk.