
Wazuh SIEM on AWS User Guide
Overview
Wazuh is a free and open source security platform that unifies SIEM and XDR capabilities. Agents on your Linux, Windows and macOS endpoints collect logs, file integrity events, running-process and package inventories, and configuration state; the Wazuh server correlates all of it against thousands of rules; and the Wazuh dashboard gives you one console for log data analysis, intrusion detection, file integrity monitoring, vulnerability detection, security configuration assessment, regulatory compliance reporting and MITRE ATT&CK mapping.
The cloudimg image installs Wazuh 4.14.6 using the project's own all-in-one deployment, so all three components — the Wazuh indexer, the Wazuh server and the Wazuh dashboard — are installed, wired together and managed by systemd on a single instance. Two things make it different from a manual install:
- Nothing shared ships in the image. Wazuh's documented default logins and the installer's build-time passwords are both removed before capture. On the first boot of every instance the appliance regenerates the entire TLS certificate chain (a new root certificate authority, and new indexer, server and dashboard certificates) and rotates every indexer account and both server API accounts to freshly generated random passwords, then writes yours to a root-only file.
- It is shaped for production from the first boot. Security event indices live on their own dedicated data volume, the Wazuh server's queue, alerts and archives live on a second one, the management API is bound to loopback, and an unauthenticated liveness endpoint is served for load balancer health checks.
What is included:
- Wazuh 4.14.6 all-in-one:
wazuh-indexer,wazuh-manager,wazuh-dashboardandfilebeat, all installed from the project's official packages wazuh-certs-firstboot.serviceregenerating the whole TLS certificate chain for this instance before the Wazuh services startwazuh-firstboot.servicerotating every indexer account and both server API accounts, then writing this instance's credentials to a root-only file- A dedicated 80 GiB volume at
/var/lib/wazuhfor the indexer's data and logs, and a dedicated 40 GiB volume at/var/ossecfor the Wazuh server, both mounted by filesystem UUID nginx.serviceserving an unauthenticated/healthendpoint on TCP 80 for load balancer and Auto Scaling probes- The Wazuh server API bound to
127.0.0.1so it is never exposed to the internet by default - Ubuntu 24.04 LTS base, fully patched at build, with unattended security upgrades enabled
Prerequisites
An active AWS account, an EC2 key pair, and a VPC with a subnet. Recommended instance type: m5.large (2 vCPU, 8 GiB), which comfortably exceeds Wazuh's documented all-in-one minimum for up to 25 agents. Size up as your agent count and event rate grow — see Step 11.
Step 1: Launch from the AWS Marketplace
Find Wazuh SIEM on the AWS Marketplace, subscribe, and launch an instance. In the launch wizard, attach a security group that allows:
| Port | Protocol | Who needs it |
|---|---|---|
| 22 | TCP | Your administrators, for SSH |
| 443 | TCP | Your administrators, for the Wazuh dashboard |
| 1514 | TCP | The endpoints you will monitor, for agent event traffic |
| 1515 | TCP | The endpoints you will monitor, for agent enrollment |
| 80 | TCP | Optional. The unauthenticated /health endpoint, for load balancer probes |
Restrict every rule to the narrowest source range that works for you. The dashboard is the only administrative surface that needs to be reachable from your network.
Step 2: Launch from the AWS CLI
AMI_ID="<marketplace-ami-id>"          # from the Marketplace listing, in your region
KEY_NAME="my-key"
SUBNET_ID="subnet-xxxxxxxx"
SG_ID="sg-xxxxxxxx"                    # allows 22 + 443 + 1514 + 1515 from your networks only
aws ec2 run-instances \
  --image-id "$AMI_ID" --instance-type m5.large \
  --key-name "$KEY_NAME" --subnet-id "$SUBNET_ID" \
  --security-group-ids "$SG_ID" \
  --metadata-options 'HttpTokens=required' \
  --tag-specifications 'ResourceType=instance,Tags=[{Key=Name,Value=wazuh-siem}]'
The image carries its own block device mappings, so the two data volumes are created and attached for you.
Connecting to your instance
Connect over SSH as the login user for your image's operating system. wazuh-certs-firstboot.service, the three Wazuh services, filebeat.service, nginx.service and wazuh-firstboot.service all start automatically on the first boot.
| Operating system | SSH login user | Connect |
|---|---|---|
| Ubuntu 24.04 LTS | ubuntu |
ssh -i my-key.pem ubuntu@<instance-public-ip> |
First boot generates a certificate chain and rotates every credential, which takes a couple of minutes on a fresh instance. Wait for /var/lib/cloudimg/wazuh-firstboot.done to appear before signing in.
Step 3: Retrieve This Instance's Credentials
First boot writes a root-only credentials file. Every instance gets different values; there is no shared or default credential in the image. List the keys it holds:
sudo test -f /var/lib/cloudimg/wazuh-firstboot.done && echo "first boot complete"
sudo grep -oE '^[A-Z_]+=' /root/wazuh-credentials.txt
first boot complete
WAZUH_DASHBOARD_URL=
WAZUH_ADMIN_USER=
WAZUH_ADMIN_PASSWORD=
WAZUH_API_URL=
WAZUH_API_USER=
WAZUH_API_PASSWORD=
To read a single value when you need it, print just that one line rather than the whole file:
sudo grep '^WAZUH_ADMIN_USER=' /root/wazuh-credentials.txt
WAZUH_ADMIN_USER=admin
WAZUH_ADMIN_PASSWORD is the dashboard login for user admin. WAZUH_API_PASSWORD is for the Wazuh server API user wazuh (Step 10). Copy them into your password manager and keep them out of your shell history.
Step 4: Verify the Services
sudo systemctl is-active wazuh-indexer wazuh-manager wazuh-dashboard filebeat nginx
sudo systemctl is-active wazuh-certs-firstboot wazuh-firstboot
active
active
active
active
active
active
active
The unauthenticated liveness endpoint is the one thing that answers without a credential, which is exactly what an Elastic Load Balancing or Auto Scaling health check needs:
curl -s -o /dev/null -w 'GET /health -> HTTP %{http_code}\n' http://127.0.0.1/health
curl -s http://127.0.0.1/health
GET /health -> HTTP 200
ok
Step 5: Prove Your Credential Is Unique to This Instance
This is the check worth doing before you trust any security appliance. Read your password out of the root-only file into a shell variable, confirm it authenticates to the indexer, and confirm that Wazuh's documented defaults do not:
PW=$(sudo grep '^WAZUH_ADMIN_PASSWORD=' /root/wazuh-credentials.txt | cut -d= -f2-)
curl -sk -o /dev/null -w 'per-instance password -> HTTP %{http_code}\n' -u "admin:$PW"             https://127.0.0.1:9200/_cluster/health
curl -sk -o /dev/null -w 'admin:admin           -> HTTP %{http_code}\n' -u 'admin:admin'           https://127.0.0.1:9200/_cluster/health
curl -sk -o /dev/null -w 'admin:SecretPassword  -> HTTP %{http_code}\n' -u 'admin:SecretPassword'  https://127.0.0.1:9200/_cluster/health
curl -sk -o /dev/null -w 'admin:wazuh           -> HTTP %{http_code}\n' -u 'admin:wazuh'           https://127.0.0.1:9200/_cluster/health
per-instance password -> HTTP 200
admin:admin           -> HTTP 401
admin:SecretPassword  -> HTTP 401
admin:wazuh           -> HTTP 401
Only your per-instance password works. The same holds for the Wazuh server API, whose documented defaults are also rotated on first boot:
APW=$(sudo grep '^WAZUH_API_PASSWORD=' /root/wazuh-credentials.txt | cut -d= -f2-)
curl -sk -o /dev/null -w 'wazuh:<per-instance>  -> HTTP %{http_code}\n' -u "wazuh:$APW"          https://127.0.0.1:55000/security/user/authenticate
curl -sk -o /dev/null -w 'wazuh:wazuh           -> HTTP %{http_code}\n' -u 'wazuh:wazuh'         https://127.0.0.1:55000/security/user/authenticate
curl -sk -o /dev/null -w 'wazuh-wui:wazuh-wui   -> HTTP %{http_code}\n' -u 'wazuh-wui:wazuh-wui' https://127.0.0.1:55000/security/user/authenticate
wazuh:<per-instance>  -> HTTP 200
wazuh:wazuh           -> HTTP 401
wazuh-wui:wazuh-wui   -> HTTP 401
While you are here, confirm the indexer cluster is healthy:
PW=$(sudo grep '^WAZUH_ADMIN_PASSWORD=' /root/wazuh-credentials.txt | cut -d= -f2-)
curl -sk -u "admin:$PW" https://127.0.0.1:9200/_cluster/health | jq '{status, number_of_nodes, active_shards}'
{
  "status": "green",
  "number_of_nodes": 1,
  "active_shards": 26
}
Step 6: Sign In to the Dashboard
Open https://<instance-public-ip>/ in a browser. The appliance uses the self-signed certificate it generated for itself on first boot, so your browser will warn you the first time; accept it, or put your own certificate in front of the dashboard (Step 13). Sign in as admin with WAZUH_ADMIN_PASSWORD.
Step 7: The Overview Console
After sign-in you land on the overview. The agents summary is empty until you enroll your first endpoint; the alerts panel is already counting, because the Wazuh server monitors the instance it runs on from the moment it starts.
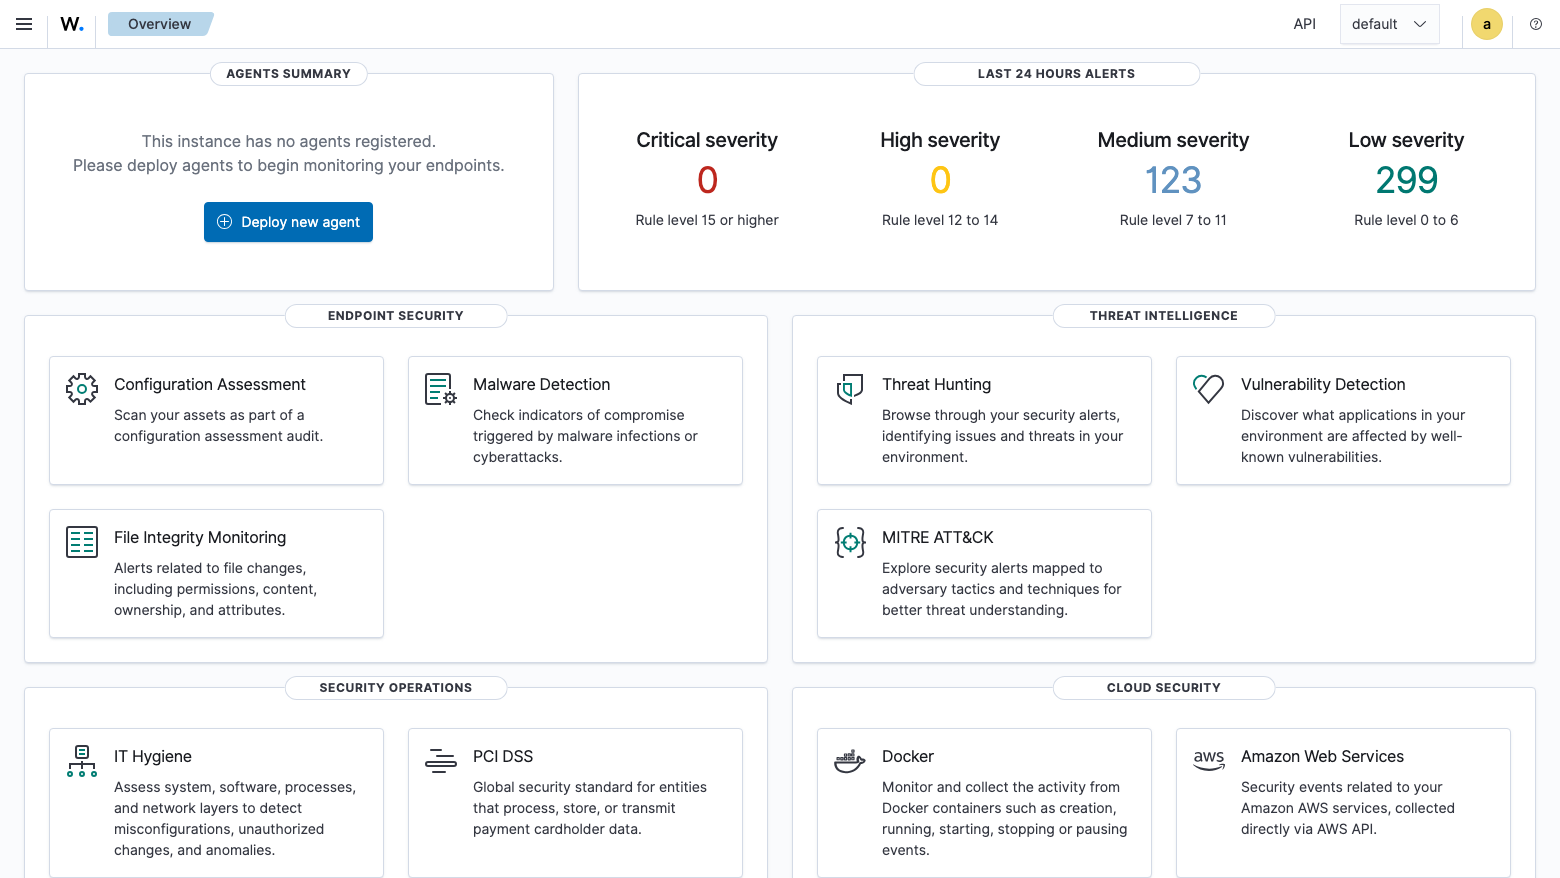
The module groups are your map of the platform:
- Endpoint security — Configuration Assessment, Malware Detection, File Integrity Monitoring
- Threat intelligence — Threat Hunting, Vulnerability Detection, MITRE ATT&CK
- Security operations — IT Hygiene, PCI DSS and the other compliance views
- Cloud security — Docker, Amazon Web Services, and the other cloud integrations
Step 8: Enroll Your First Agent
Wazuh collects from endpoints through its agent. In the dashboard choose Deploy new agent and the wizard builds the exact install and enrollment command for the operating system, architecture and server address you pick.
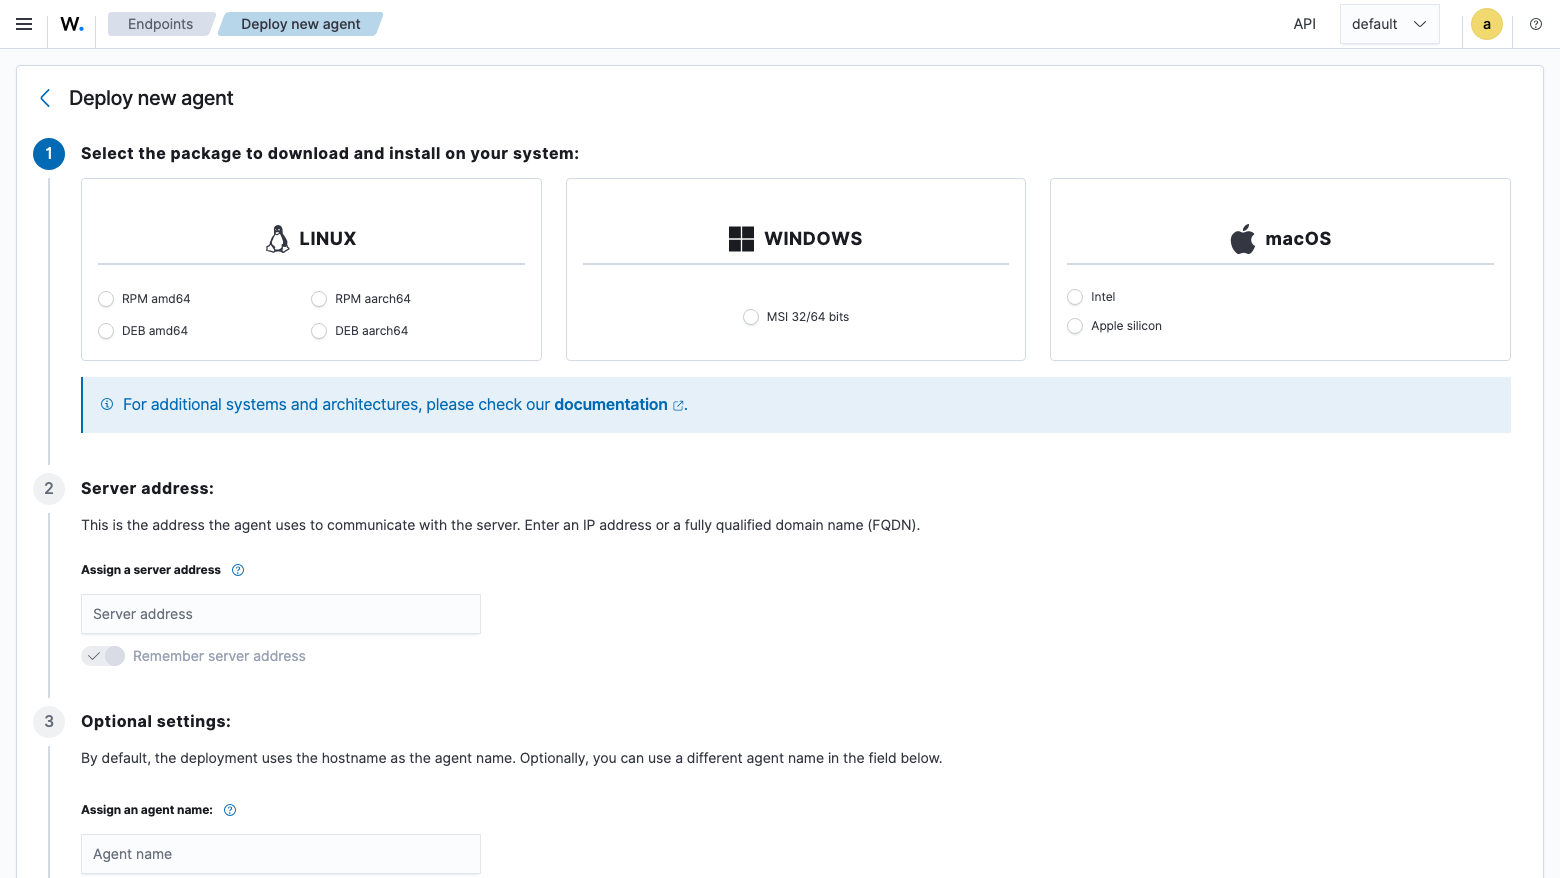
Set Server address to this instance's public IP or DNS name, and make sure your security group allows TCP 1514 and 1515 from the endpoint. The wizard then gives you a one-line command to run as root on the endpoint you want to monitor — it looks like this for a Debian or Ubuntu host:
# Run this on the ENDPOINT you want to monitor, not on the Wazuh server.
WAZUH_MANAGER='<public-ip>' dpkg -i ./wazuh-agent.deb
systemctl daemon-reload && systemctl enable --now wazuh-agent
Confirm on the Wazuh server that the enrollment listener is up before you start:
sudo ss -tlnp | grep -E ':(1514|1515) '
LISTEN 0 128 0.0.0.0:1514 0.0.0.0:*  users:(("wazuh-remoted",...))
LISTEN 0 128 0.0.0.0:1515 0.0.0.0:*  users:(("wazuh-authd",...))
New agents appear in the dashboard within a minute of enrolling, and their events start flowing into Threat Hunting immediately.
Step 9: Threat Intelligence and MITRE ATT&CK
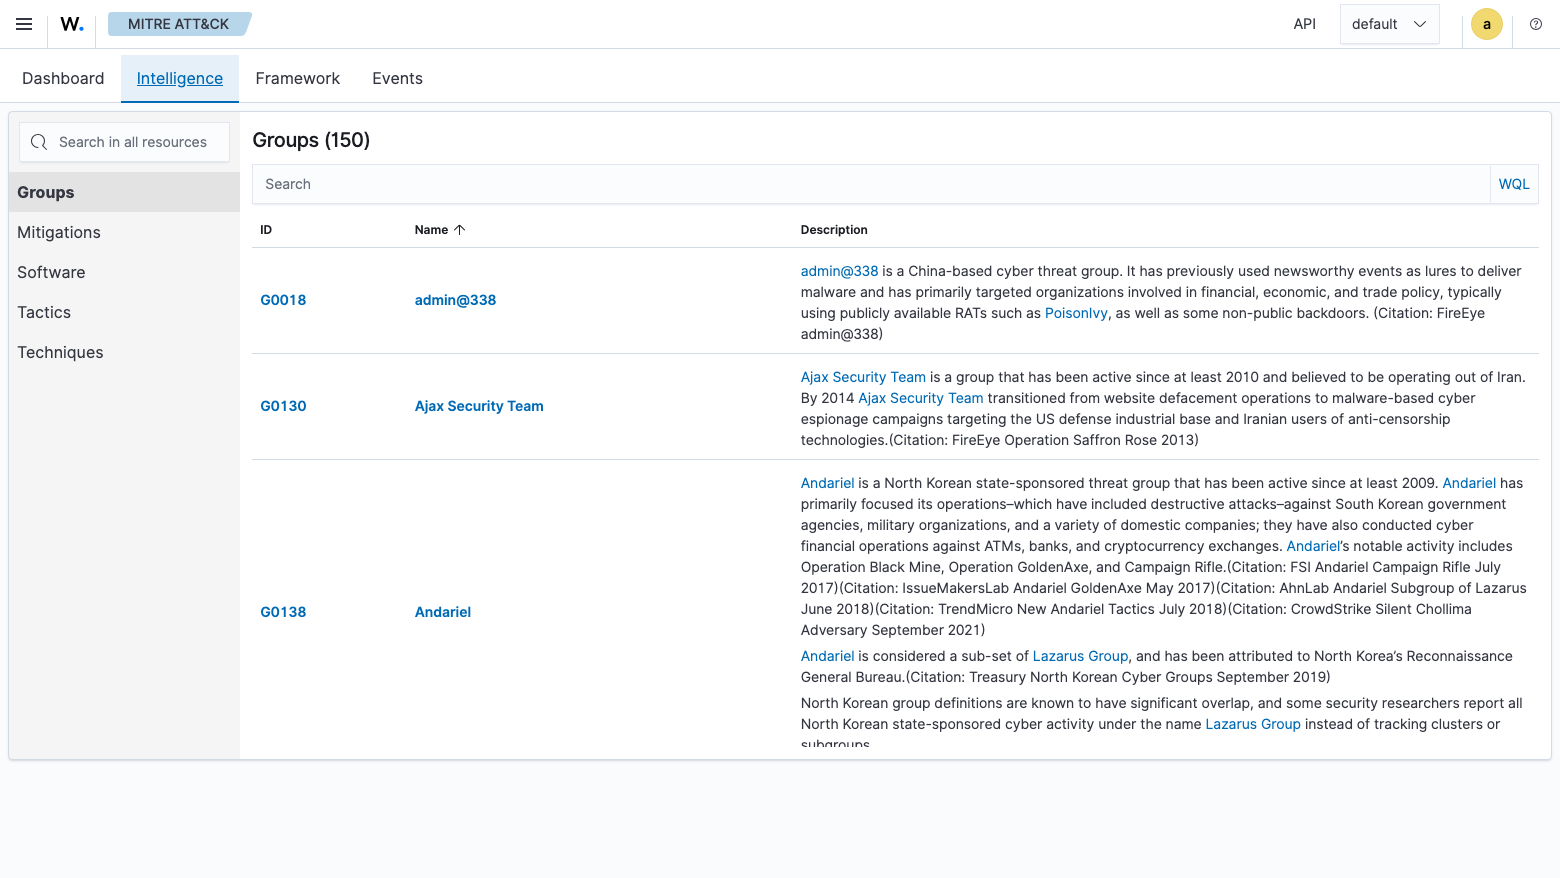
The image ships Wazuh's MITRE ATT&CK integration, which maps alerts onto adversary tactics and techniques and carries the full ATT&CK reference — threat groups, mitigations, software, tactics and techniques — locally in the dashboard, so you can pivot from an alert to the technique behind it without leaving the console.
Step 10: The Wazuh Server API
The Wazuh server exposes a REST API that the dashboard uses and that you can drive yourself for automation. In this image it is deliberately bound to 127.0.0.1, so it is not reachable from the network unless you choose to publish it. Query it from the instance:
APW=$(sudo grep '^WAZUH_API_PASSWORD=' /root/wazuh-credentials.txt | cut -d= -f2-)
TOKEN=$(curl -sk -u "wazuh:$APW" -X POST https://127.0.0.1:55000/security/user/authenticate | jq -r .data.token)
curl -sk -H "Authorization: Bearer $TOKEN" https://127.0.0.1:55000/manager/status | jq -r '.data.affected_items[0] | to_entries[] | "\(.key)  \(.value)"' | head -12
wazuh-agentlessd  stopped
wazuh-analysisd  running
wazuh-authd  running
wazuh-csyslogd  stopped
wazuh-dbd  stopped
wazuh-monitord  running
wazuh-execd  running
wazuh-integratord  stopped
wazuh-logcollector  running
wazuh-maild  stopped
wazuh-remoted  running
wazuh-reportd  stopped
The daemons that matter for collection and correlation are running; the ones reported as stopped are optional integrations (syslog forwarding, mail alerting, third-party integrations, cluster mode) that you enable in /var/ossec/etc/ossec.conf if you need them.
To reach it from your workstation without exposing it, tunnel over SSH rather than changing the bind address:
ssh -i my-key.pem -L 55000:127.0.0.1:55000 ubuntu@<public-ip>
If you genuinely need the API published, edit host in /var/ossec/api/configuration/api.yaml, restart wazuh-manager, and open TCP 55000 only to the specific addresses that need it.
Step 11: Where Your Data Lives
Security event indices grow fast, and the Wazuh server's queue, alerts and archives grow alongside them. This image keeps both off the operating system disk, each on its own volume you can resize independently:
df -hT /var/lib/wazuh /var/ossec /
sudo grep -E 'wazuh|ossec' /etc/fstab
Filesystem     Type  Size  Used Avail Use% Mounted on
/dev/nvme0n1   ext4   79G  5.7M   75G   1% /var/lib/wazuh
/dev/nvme2n1   ext4   40G   13G   25G  35% /var/ossec
/dev/root      ext4   48G  7.1G   41G  15% /
UUID=ce1b8983-88c6-4c47-8206-cff448ddf911 /var/lib/wazuh ext4 defaults,nofail 0 2
UUID=85a04686-bafb-47ac-819f-96e9efb34bd2 /var/ossec ext4 defaults,nofail 0 2
The UUIDs above are from the instance this guide was verified against; yours will differ.
The indexer writes its shards and its own logs under /var/lib/wazuh; the Wazuh server keeps everything under /var/ossec. Both fstab entries reference the filesystem UUID, so the layout survives a stop and start and any change in NVMe device naming. To grow either tier, expand the EBS volume in the console then run sudo resize2fs on the device — no reinstall and no data movement.
Confirm the indexer really is writing to the dedicated volume:
sudo grep -E '^path\.(data|logs):' /etc/wazuh-indexer/opensearch.yml
sudo du -sh /var/lib/wazuh/indexer-data
path.data: /var/lib/wazuh/indexer-data
path.logs: /var/lib/wazuh/indexer-logs
5.6M    /var/lib/wazuh/indexer-data
Sizing. Wazuh's own guidance for an all-in-one deployment is 2 vCPU and 4 GiB for up to 25 agents, so m5.large is the recommended starting point. Past roughly 25 agents, or if you enable archiving of every event rather than only alerts, move to m5.xlarge or larger and raise the indexer heap in /etc/wazuh-indexer/jvm.options to about half the instance memory. Retention is governed by the index lifecycle policy in the dashboard under Index Management.
Step 12: Certificates Are Unique to Your Instance
The Wazuh components authenticate to each other with TLS client certificates, and the indexer treats its admin certificate as a superuser credential. A baked certificate chain would therefore be a shared secret across every deployment of the image, so this appliance does not ship one: wazuh-certs-firstboot.service mints a brand new root certificate authority and a new certificate for each component before the Wazuh services start, and the root private key is generated in memory and never written to disk.
sudo openssl x509 -noout -subject -issuer -dates -in /etc/wazuh-indexer/certs/root-ca.pem
subject=OU = Wazuh, O = Wazuh, L = California
issuer=OU = Wazuh, O = Wazuh, L = California
notBefore=Jul 25 23:44:07 2026 GMT
notAfter=Jul 22 23:44:07 2036 GMT
The notBefore date is the moment your instance first booted, not the date the image was built. That is the check that proves the chain is yours.
Step 13: Put Your Own Certificate in Front of the Dashboard
The dashboard's own certificate is self-signed, which is fine for an internal console but produces a browser warning. For a public or shared deployment, terminate TLS with a certificate your users already trust. The simplest route on AWS is an Application Load Balancer with an AWS Certificate Manager certificate, forwarding to the instance on TCP 443 and using http://<instance-private-ip>/health as the target group health check.
Alternatively, replace the dashboard's certificate in place: put your certificate and key at /etc/wazuh-dashboard/certs/wazuh-dashboard.pem and /etc/wazuh-dashboard/certs/wazuh-dashboard-key.pem, keep the ownership and 0400 permissions the existing files have, and restart wazuh-dashboard. Leave the indexer and server certificates alone — those are the internal chain from Step 12.
Step 14: Keeping the Appliance Current
The operating system is fully patched at build and has unattended security upgrades enabled, so OS security fixes apply themselves. Wazuh itself is upgraded on your schedule, following the project's documented upgrade path for the version you are moving to; upgrade the indexer first, then the server, then the dashboard, and take an EBS snapshot of both data volumes before you begin.
Check what you are running:
dpkg-query -W -f='${Package} ${Version}\n' wazuh-manager wazuh-indexer wazuh-dashboard filebeat
wazuh-manager 4.14.6-1
wazuh-indexer 4.14.6-1
wazuh-dashboard 4.14.6-1
filebeat 7.10.2-2
Troubleshooting
The dashboard will not load. Give it a minute after first boot: the indexer has to be up before the dashboard will serve. sudo systemctl status wazuh-dashboard and sudo journalctl -u wazuh-dashboard -n 50 show what it is waiting for.
First boot did not finish. /var/lib/cloudimg/wazuh-firstboot.done is only created after every credential has been rotated and verified. If it is missing, sudo journalctl -u wazuh-certs-firstboot -u wazuh-firstboot --no-pager shows exactly which step failed.
An agent will not enroll. Check TCP 1515 is reachable from the endpoint and that the endpoint is using this instance's address as its manager. sudo tail -n 50 /var/ossec/logs/ossec.log on the server shows enrollment attempts as they arrive.
The indexer will not start after resizing. Confirm both volumes are mounted (df -hT /var/lib/wazuh /var/ossec); the nofail fstab option deliberately lets the instance boot without them so you can fix the mount rather than losing SSH.
Support
cloudimg provides 24/7 technical support for this image, covering deployment, agent enrollment, rule and decoder tuning, storage sizing and retention, upgrades, and putting your own certificate in front of the dashboard. Email support@cloudimg.co.uk with your instance ID and a description of the issue.
Wazuh is a trademark of Wazuh Inc. Wazuh is distributed under the GNU General Public License version 2. All product and company names are trademarks or registered trademarks of their respective holders.