Base
Hardened build
minimal ports, security patches applied at build time
the complete IoT telemetry pipeline on one VM: an MQTT broker, a flow engine, a time series database and dashboards, wired together end to end and ready for device data at first boot.
This is a ready to use Internet of Things appliance that bundles four open source tools into one working pipeline. Eclipse Mosquitto is the MQTT broker that devices connect to and publish their readings into. Node-RED is the flow based low code engine that receives those readings, parses and reshapes them, and routes them onward. InfluxDB 2 is the time series database that stores every reading as a point on a timeline. Grafana is the dashboard platform that turns those stored series into live charts.
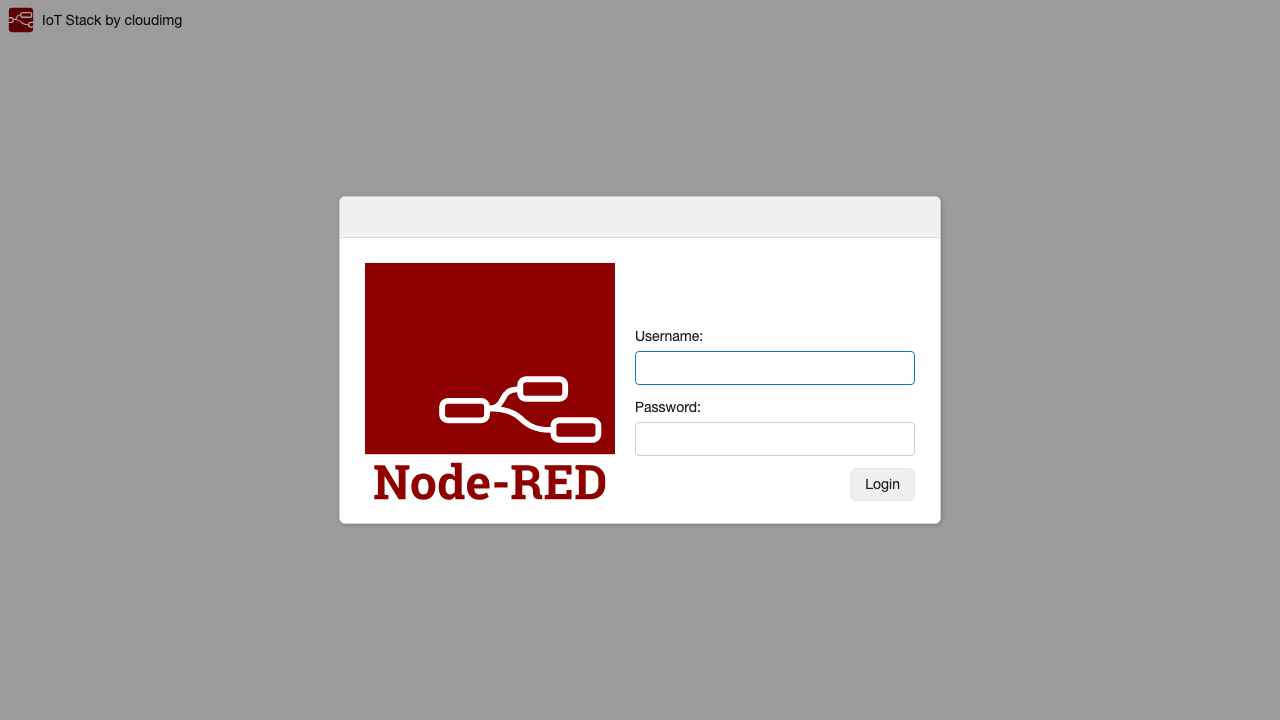
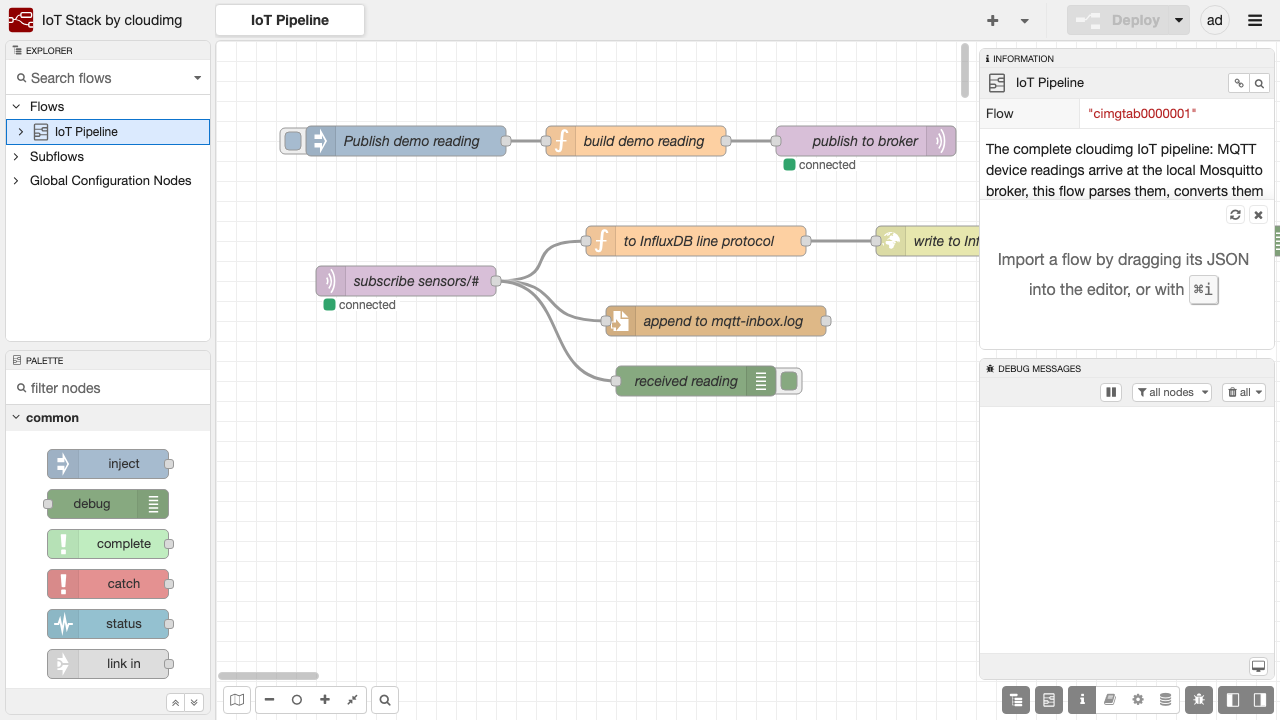
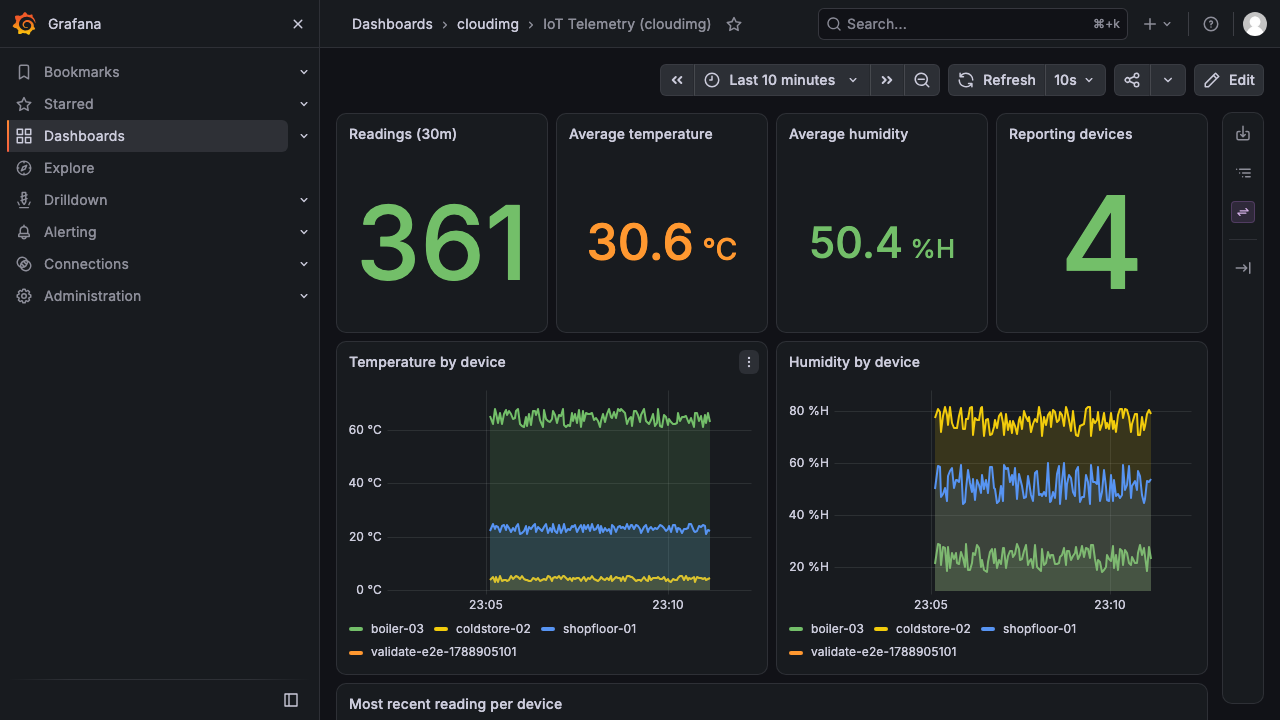
What makes it an appliance rather than four packages is that the path between them is already built. Node-RED ships with a flow that subscribes to the broker, converts incoming JSON readings into InfluxDB line protocol and writes them to the database, and Grafana ships with the InfluxDB data source and a starter telemetry dashboard already provisioned against the same bucket. Publish a reading from any MQTT client and it travels broker to flow to database to chart without you configuring a single connection. From there the flow editor is the place you extend the pipeline: add device specific parsing, alerting, filtering or extra destinations, using the same drag and drop editor the demo flow is built in.
Four services on one box is exactly where a self assembled stack goes wrong, because each one ships with its own insecure default: an anonymous MQTT broker, a Node-RED editor with no authentication at all, an InfluxDB waiting to be claimed by whoever reaches it first, and a Grafana that still answers to admin and admin. cloudimg closes all four before the image is ever reachable. The broker ships with an empty password store so every connection is refused, InfluxDB ships with its setup never run, so its API rejects every call, and the flow editor and dashboards are held shut behind a boot gate so they cannot start at all until one first boot routine has generated a fresh password, token and secret for each of the four services and written them to a file only root can read. There is no known or default credential anywhere in the image, and no two instances share one. Only four ports are reachable: SSH, a health check, HTTPS and MQTT over TLS, with the database, the flow runtime and the dashboard server all bound to the loopback interface behind a single TLS terminator whose certificate is generated per instance. Every instance proves itself on first boot by publishing a real reading and reading that exact point back out of the database, so a broken pipeline fails loudly instead of shipping quietly. The base is fully patched with unattended security updates enabled, and every image is paired with a step by step deploy guide tested against this exact build and backed by 24/7 cloudimg support.
Real screenshots taken while testing this image against its deployment guide.

AKHQ for Apache Kafka on Ubuntu 24.04 LTS preconfigured machine image for Microsoft Azure, hardened and verified with 24...

Apache ActiveMQ Artemis is the next generation, high performance, multi protocol Java message broker that implements the...

Apache BifroMQ (Incubating) is a distributed MQTT broker written in Java, built around native multi tenancy.

Apache Iggy is a persistent message streaming platform written in Rust that moves millions of messages per second over T...

The cloudimg image ships the free and open source, Apache 2.0 licensed James 3.9.0, in its single node distribution.
This image runs Apache Kafka 4.2.0 as a single node KRaft broker on Ubuntu 22.04 LTS. The broker process combines the co...