Base
Hardened build
minimal ports, security patches applied at build time

PoWA, the PostgreSQL Workload Analyzer, shipped as a complete workload analysis appliance that begins by analysing its own PostgreSQL instance.
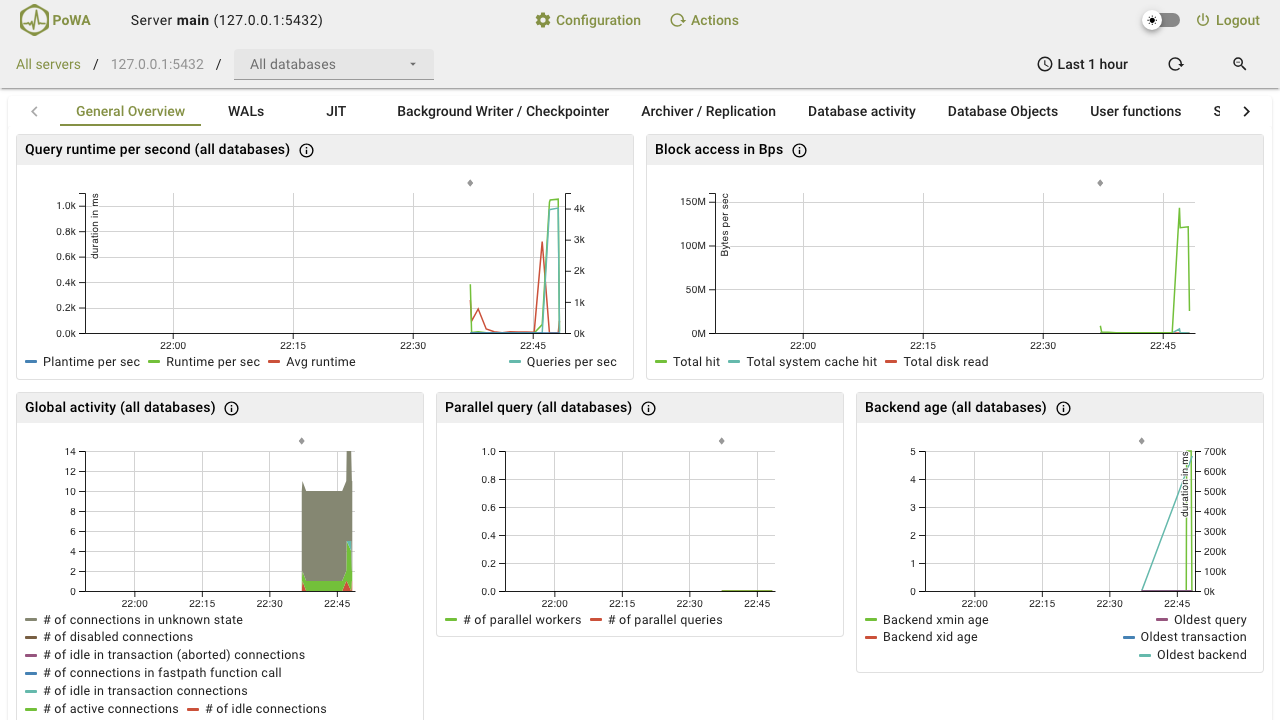
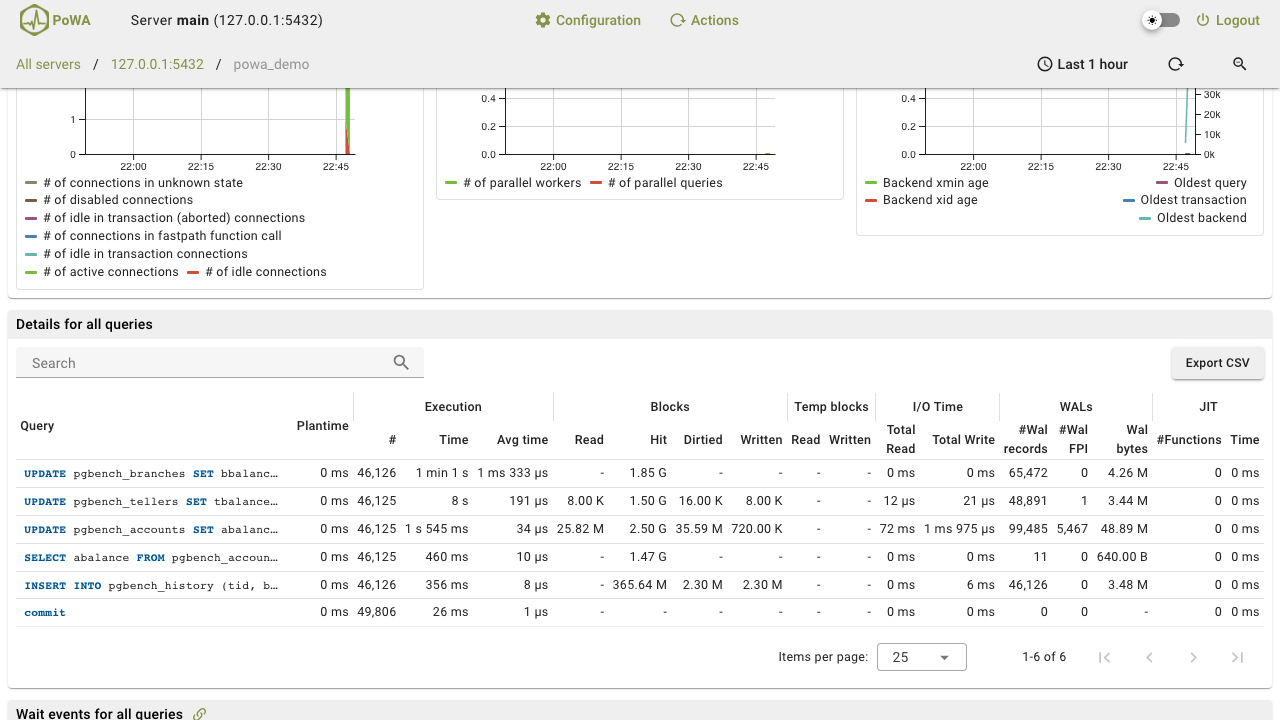
PoWA is a workload analysis platform for PostgreSQL. A set of statistics collection extensions record what the server is doing, a background worker snapshots them on an interval into a repository database, and a web interface turns those snapshots into time series charts: query time and calls, buffer and input output activity, wait events, checkpointer and background writer behaviour, and per database activity. Because it stores a history rather than a single instantaneous reading, it answers the question a live statistics view cannot: what changed, and when.
It also carries an index suggestion wizard. Predicate statistics captured by pg_qualstats tell it which columns your slowest queries actually filter on, and hypothetical indexes let it cost a candidate index against the real planner without building it, so a suggestion arrives with an estimated gain attached rather than as a guess.
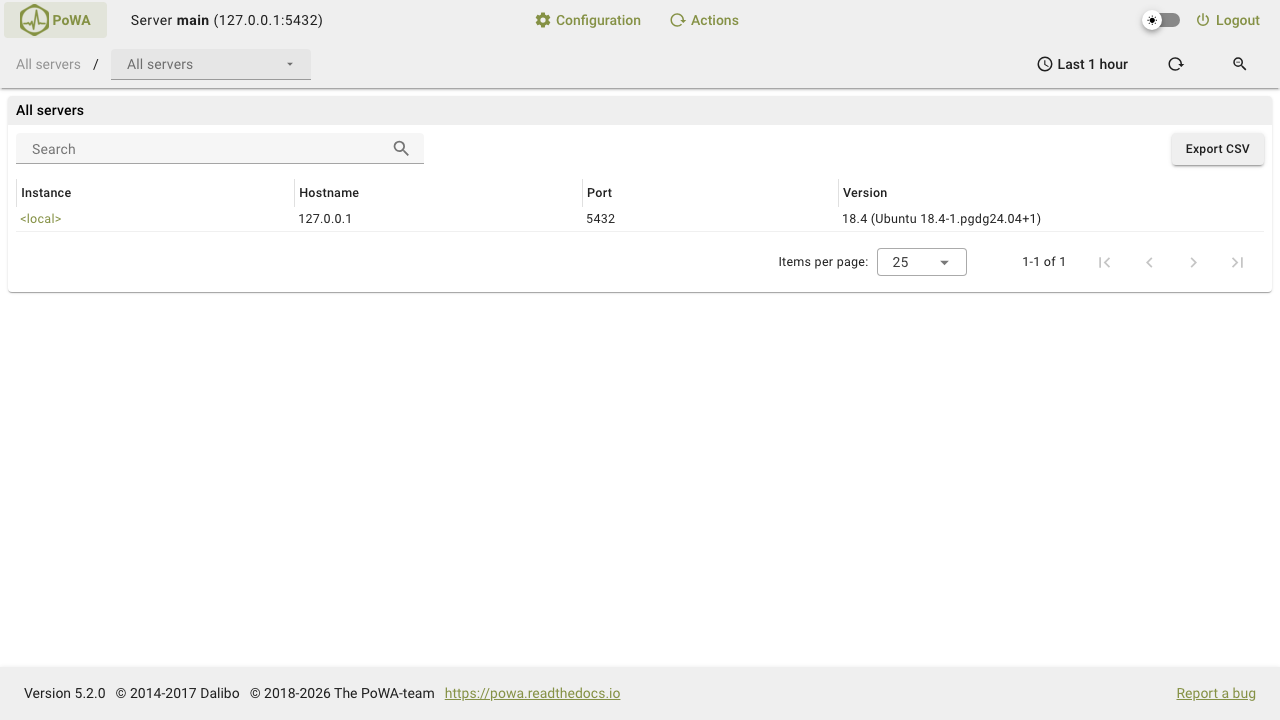
This image is a complete appliance rather than a bare console. It registers the PostgreSQL instance it is installed in as the first monitored server, so it is analysing a real database from the moment it starts, and further servers can be attached later by installing the same collection extensions on them and registering them from the interface.
cloudimg ships an appliance that is useful on its own rather than one that waits to be pointed at something. The bundled PostgreSQL 18 is configured as the first monitored server, with the whole statistics stack preloaded in the order the collectors require, snapshots every minute and a week of retention, so a chart exists within minutes of first boot. The repository lives on its own dedicated volume, which is what lets you widen retention or attach more servers by resizing storage instead of rebuilding.
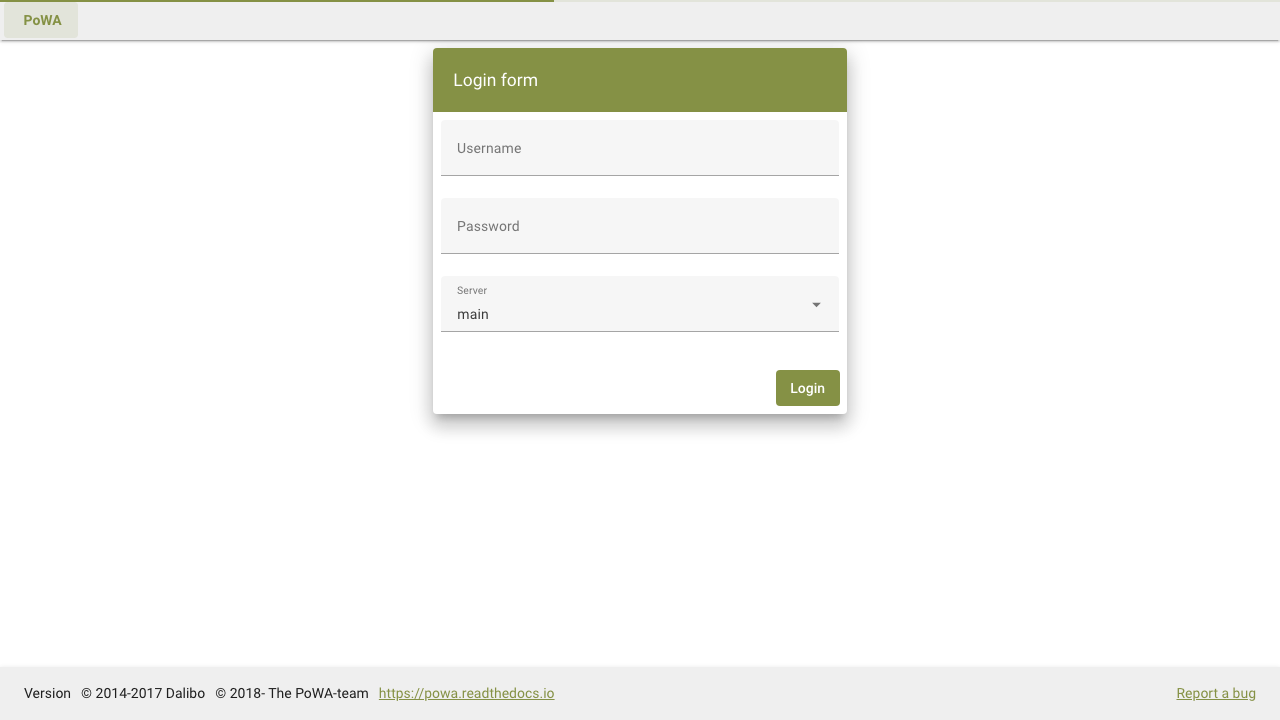
Nothing usable is baked in. The web interface authenticates against PostgreSQL itself, so its login credential is a database role, and that role does not exist in the image at all: it is created uniquely on each machine at first boot, along with the session signing key, and written to a file only the root user can read. The interface cannot even start until first boot has minted them. Only the web interface and SSH are reachable from the network, because both PostgreSQL and the interface bind the loopback address and a single front door proxies to them. A demo workload tool ships in the image so collection can be proven end to end in about a minute rather than trusted. The base is fully patched with unattended security updates enabled, PostgreSQL keeps receiving updates from its upstream repository, and every deployment is paired with a step by step deploy guide and backed by 24/7 cloudimg support.
Real screenshots taken while testing this image against its deployment guide.