
InfluxDB on AWS User Guide
Overview
This image runs InfluxDB, the open source time-series database, on a single node. InfluxDB stores timestamped measurements such as application and infrastructure metrics, IoT sensor data, industrial telemetry, and financial market data, and exposes every operation over an HTTP API together with a built in browser interface for ad hoc exploration and dashboards.
The InfluxDB HTTP API and the built in web interface, which includes the Data Explorer, Dashboards, Tasks, and Alerts pages, all listen on port 8086. An nginx reverse proxy is installed and fronts InfluxDB on the default HTTP port 80 so the web interface is reachable on http://<instance>/ without specifying a port number, which is also the recommended path for terminating TLS later.
The InfluxDB administrator password and the initial admin API token are generated on the first boot of every deployed instance. Two instances launched from the same Amazon Machine Image never share credentials. The image runs the InfluxDB setup wizard non-interactively against the local instance on first boot, generates a fresh admin password and a fresh initial admin token, and stores both plain text values in /root/influxdb-credentials.txt with mode 0600 so that only the root user can read the file.
InfluxDB's database files, including the TSM engine and the write ahead log, are kept on a dedicated EBS data volume mounted at /var/lib/influxdb, separate from the operating system disk, so the data tier can be resized independently of the root volume.
Prerequisites
Before you deploy this image you need:
- An Amazon Web Services account where you can launch EC2 instances
- IAM permissions to launch instances, create security groups, and subscribe to AWS Marketplace products
- An EC2 key pair in the target Region for SSH access to the instance
- A VPC and subnet in the target Region, with a security group allowing inbound port 22 from your management network and inbound port 80 (or port 8086) from the trusted networks that host the applications which will talk to InfluxDB
- The AWS CLI (version 2) installed locally if you plan to deploy from the command line
Step 1: Launch the Instance from the AWS Marketplace
Sign in to the AWS Management Console, open the EC2 service, and select Launch instance. Under Application and OS Images choose AWS Marketplace AMIs and search for InfluxDB. Select the cloudimg listing and choose Select, then Continue on the subscription summary.
Pick an instance type of m5.large or larger. Choose your EC2 key pair under Key pair (login). Under Network settings select your VPC and subnet, and either create or select a security group that allows inbound port 22 from your management network and inbound port 80 from the trusted networks that will reach the InfluxDB web interface. If you also want to talk to the raw InfluxDB HTTP API on its native port, open port 8086 to the same trusted networks. Do not open ports 80 or 8086 to the public internet without first terminating TLS and restricting access. Leave the root volume at the default size or larger.
Select Launch instance. First boot initialisation takes approximately one minute after the instance state becomes Running and the status checks pass.
Step 2: Launch the Instance from the AWS CLI
The following block launches an instance from the cloudimg InfluxDB Marketplace AMI into an existing subnet and security group. Replace <ami-id> with the AMI ID shown on the Marketplace listing, <key-name> with your EC2 key pair name, <subnet-id> with your subnet ID, and <security-group-id> with a security group that opens ports 22 and 80 as described above.
aws ec2 run-instances \
  --image-id <ami-id> \
  --instance-type m5.large \
  --key-name <key-name> \
  --subnet-id <subnet-id> \
  --security-group-ids <security-group-id> \
  --block-device-mappings '[{"DeviceName":"/dev/sda1","Ebs":{"VolumeSize":30,"VolumeType":"gp3"}}]' \
  --tag-specifications 'ResourceType=instance,Tags=[{Key=Name,Value=influxdb-01}]'
The command prints a JSON document on success. Note the instance ID, then retrieve its public address once it is running with aws ec2 describe-instances --instance-ids <instance-id> --query "Reservations[].Instances[].PublicIpAddress" --output text.
Step 3: Connect and Retrieve the Administrator Credentials
Connect over SSH with the key pair you selected and the public IP address from step 2. The SSH login user depends on the operating system of the AMI variant you launched:
| AMI variant | SSH login user |
|---|---|
| InfluxDB 2 on Ubuntu 24.04 | ubuntu |
The first boot service runs after InfluxDB has started but before SSH is generally used, and on a normal launch the credentials file is in place a few seconds after the instance reaches Running.
ssh <login-user>@<public-ip>
sudo cat /root/influxdb-credentials.txt
You will see a plain text file containing the InfluxDB web URL, the raw InfluxDB API URL, the administrator username (admin), the administrator password, the initial admin API token, the org name, and the name of the default bucket. Copy these values somewhere secure such as a password manager or an encrypted vault, and do not commit them to source control.
Each command block in this guide that talks to InfluxDB begins by reading the admin token from the credentials file into a TOKEN shell variable, so every block is self contained:
TOKEN="$(sudo awk -F= '/^influxdb.admin.token=/ {print $2}' /root/influxdb-credentials.txt)"
ORG="$(sudo awk -F= '/^influxdb.admin.org=/ {print $2}' /root/influxdb-credentials.txt)"
echo "token length: ${#TOKEN}  org: $ORG"
Step 4: Verify the Server is Healthy
InfluxDB exposes two endpoints that confirm the server is running, and both are reachable without authentication. The /ping endpoint returns HTTP 204 No Content if the daemon is up, and /health returns a JSON status document:
curl -sI http://127.0.0.1:8086/ping
curl -s http://127.0.0.1:8086/health
The health response reports "status":"pass" together with the installed InfluxDB version:
{"name":"influxdb", "message":"ready for queries and writes", "status":"pass", "checks":[], "version": "v2.9.1", "commit": "d4fa1941fd"}
The /api/v2/setup endpoint reports {"allowed":false} on a fully initialised instance, which confirms that first boot has already run setup and the server is no longer awaiting initial provisioning.
curl -s http://127.0.0.1:8086/api/v2/setup
Step 5: Server Components
| Component | Version | Source |
|---|---|---|
| InfluxDB | 2.9.x | repos.influxdata.com |
| influx CLI | 2.8.x | repos.influxdata.com |
| nginx | 1.24.x | Ubuntu archive |
| Ubuntu | 24.04 LTS | cloudimg golden base image |
| cloudimg overrides | /etc/influxdb/config.toml, /etc/nginx/sites-available/influxdb |
baked into the image |
InfluxDB 2 ships as a self contained Go binary, so the image has no JVM dependency and no separate runtime. nginx is the only adjacent process and exists to serve the InfluxDB user interface on the default HTTP port so customers can reach it without specifying a port number.
Step 6: Filesystem Layout
InfluxDB is self contained, and its database files live on a dedicated EBS volume mounted at /var/lib/influxdb. The main directories and files the image exposes are:
/usr/bin/influxd— the InfluxDB server binary/usr/bin/influx— the InfluxDB command line client/etc/influxdb/config.toml— cloudimg server configuration (bolt path, engine path, bind address)/var/lib/influxdb/influxd.bolt— the metadata KV store (orgs, users, tokens, buckets, dashboards)/var/lib/influxdb/engine/— the TSM time-series engine, write ahead log, and series index, on the dedicated data volume/etc/nginx/sites-available/influxdb— nginx reverse proxy config for port 80/var/log/syslog— combined log output via systemd journal/root/influxdb-credentials.txt— per instance admin password and token, mode 0600 root only
Step 7: Start, Stop, and Check Status
InfluxDB runs as the systemd service influxdb.service, and nginx runs as nginx.service. The first boot unit is influxdb-firstboot.service and is skipped on every boot after the first because its sentinel lives at /var/lib/cloudimg/influxdb-firstboot.done. You interact with the services using systemctl:
sudo systemctl status --no-pager influxdb
sudo systemctl is-active influxdb
sudo systemctl is-active nginx
To restart the server after editing configuration:
sudo systemctl restart influxdb
The InfluxDB service runs as the influxdb system user and owns /var/lib/influxdb. nginx runs as www-data and only listens on port 80, forwarding to InfluxDB on the loopback.
Step 8: Open the Web Interface
The InfluxDB user interface, which includes the Data Explorer, Dashboards, Tasks, and Alerts pages, is served by InfluxDB itself on port 8086 and is also reachable on port 80 through the nginx reverse proxy. Once you have opened port 80 in the security group from your management network, open the following URL in your browser:
http://<public-ip>/
You are redirected to the sign in page. Enter the administrator username admin and the administrator password from /root/influxdb-credentials.txt.

After you sign in, the Data Explorer opens. The left hand nav rail gives you the Data Explorer, Notebooks, Dashboards, Tasks, Alerts, and Settings pages. The Data Explorer is the day to day query and exploration tool: pick a bucket on the left, choose tag filters and a measurement, set the time range, and either run the query as Flux or switch to Script Editor to edit the Flux directly.

The Dashboards page is where you save query results as live charts. A freshly launched instance has no dashboards, and the empty state lets you click Create Dashboard to build the first one.

Step 9: Write Data with Line Protocol
InfluxDB writes data over HTTP using the line protocol format: a measurement name, optional tag pairs, one or more field values, and a timestamp. Push a single point to the default bucket using the admin API token:
TOKEN="$(sudo awk -F= '/^influxdb.admin.token=/ {print $2}' /root/influxdb-credentials.txt)"
ORG="$(sudo awk -F= '/^influxdb.admin.org=/ {print $2}' /root/influxdb-credentials.txt)"
curl -s -H "Authorization: Token $TOKEN" \
  -H 'Content-Type: text/plain' \
  -X POST "http://127.0.0.1:8086/api/v2/write?org=$ORG&bucket=default&precision=s" \
  --data-binary "cpu,host=server01,region=us-east-1 usage=0.42 $(date +%s)"
The endpoint returns HTTP 204 No Content on success. Send multiple points in a single request by separating each line of line protocol with a newline character.
Step 10: Query with Flux
Flux is InfluxDB 2's primary query language. The following query reads the last hour of cpu measurements from the default bucket, computes the mean of the usage field over one minute windows, and returns the result as annotated CSV:
TOKEN="$(sudo awk -F= '/^influxdb.admin.token=/ {print $2}' /root/influxdb-credentials.txt)"
ORG="$(sudo awk -F= '/^influxdb.admin.org=/ {print $2}' /root/influxdb-credentials.txt)"
curl -s -H "Authorization: Token $TOKEN" \
  -H 'Content-Type: application/vnd.flux' \
  -X POST "http://127.0.0.1:8086/api/v2/query?org=$ORG" \
  --data-binary 'from(bucket:"default") |> range(start: -1h) |> filter(fn:(r)=>r._measurement=="cpu") |> aggregateWindow(every:1m, fn:mean)'
You can also drive the same query from the Data Explorer page in the web interface by selecting the bucket, the measurement, and the time range from the visual builder, then switching to Script Editor to see and edit the underlying Flux.
For users familiar with the InfluxDB 1.x query language, an InfluxQL compatibility endpoint is also available at /api/v2/query?type=influxql.
Step 11: Use the influx CLI
The influx command line client is preinstalled. Create a local config that points at the running instance, then list the buckets you can read:
TOKEN="$(sudo awk -F= '/^influxdb.admin.token=/ {print $2}' /root/influxdb-credentials.txt)"
ORG="$(sudo awk -F= '/^influxdb.admin.org=/ {print $2}' /root/influxdb-credentials.txt)"
influx config create -n local -u http://127.0.0.1:8086 -t "$TOKEN" -o "$ORG" -a
influx bucket list
The same CLI manages users, organisations, tokens, tasks, and dashboards. Run influx help for the full reference.
Step 12: Create Per Application Tokens
The initial admin token should never be used by application traffic. Create a per application token scoped to a single bucket so that the application can only read and write the data it owns:
TOKEN="$(sudo awk -F= '/^influxdb.admin.token=/ {print $2}' /root/influxdb-credentials.txt)"
ORG="$(sudo awk -F= '/^influxdb.admin.org=/ {print $2}' /root/influxdb-credentials.txt)"
influx auth create \
  --org "$ORG" \
  --description "writer for the metrics-prod bucket" \
  --read-bucket "<bucket-id>" \
  --write-bucket "<bucket-id>"
Replace <bucket-id> with the id of the bucket the application should access; list buckets with influx bucket list. The CLI prints the new token on success. Distribute it to your application via your secrets manager, never via source control.
Step 13: Rotate the Administrator Password
For a production deployment, rotate the administrator password that was generated on first boot. The influx CLI prompts for the new value and writes it through the InfluxDB API.
influx user password -n admin
sudo sed -i "s|^influxdb.admin.pass=.*|influxdb.admin.pass=<new-password>|" /root/influxdb-credentials.txt
Store the new value in your secrets manager immediately. The file /root/influxdb-credentials.txt should not be considered your source of truth after first boot.
Step 14: Tasks and Retention
InfluxDB has two features for managing how long data is kept and how it is rolled up over time:
- Retention policies on each bucket drop points older than a fixed age. Set retention with
influx bucket update --id <bucket-id> --retention 720hfor thirty days. - Tasks are scheduled Flux scripts that downsample, aggregate, or copy data between buckets. Tasks are visible and editable on the Tasks page of the web interface.
A typical downsampling task aggregates one second raw data into one minute averages every minute, writes the result into a metrics-1m bucket with a longer retention, and lets the raw bucket roll off after a few days.
Step 15: Enable HTTPS with a Reverse Proxy
The cloudimg image fronts InfluxDB with an nginx reverse proxy on port 80. For any deployment that carries customer traffic, terminate TLS in the same nginx so that credentials and data are not sent in clear text. A Let's Encrypt certificate gives you HTTPS without changing the InfluxDB configuration.
The following assumes you have a DNS record pointing your fully qualified domain name at the instance's public IP address.
sudo apt-get update && sudo apt-get install -y certbot python3-certbot-nginx
sudo certbot --nginx -d influxdb.your-domain.example \
  --non-interactive --agree-tos -m you@your-domain.example \
  --redirect
Certbot edits the cloudimg nginx site config to terminate TLS, and customer applications then talk to https://influxdb.your-domain.example. Restrict ports 80 and 8086 in the security group to the loopback and your application subnets once the proxy is in place.
Step 16: Backups and Maintenance
InfluxDB has a built in backup command that writes a portable archive of every bucket, user, organisation, and dashboard on the instance:
TOKEN="$(sudo awk -F= '/^influxdb.admin.token=/ {print $2}' /root/influxdb-credentials.txt)"
ORG="$(sudo awk -F= '/^influxdb.admin.org=/ {print $2}' /root/influxdb-credentials.txt)"
sudo mkdir -p /var/backups/influxdb
sudo influx backup --token "$TOKEN" --host http://127.0.0.1:8086 /var/backups/influxdb/$(date +%F)
Ship the archive to an Amazon S3 bucket or another object store. For larger databases, take an Amazon EBS snapshot of the /var/lib/influxdb volume instead, which is faster and is consistent for the InfluxDB engine if the daemon is briefly stopped or if your workload tolerates a crash consistent snapshot.
For kernel and package updates, Ubuntu's unattended-upgrades is enabled by default, so security patches apply automatically. To update InfluxDB itself, use sudo apt-get update && sudo apt-get install --only-upgrade influxdb2 influxdb2-cli and then restart the service.
Step 17: Scaling Beyond a Single Instance
This image is a single node InfluxDB. For larger deployments:
- Grow the
/var/lib/influxdbEBS volume and extend the filesystem when the database outgrows the initial disk - Push higher cardinality and longer retention workloads to InfluxDB Cloud or InfluxDB Enterprise, both of which speak the same API
- Put the InfluxDB tier behind an Application Load Balancer with TLS termination, with the security group restricting ports 80 and 8086 to the load balancer and the application subnets
- Use scheduled Flux tasks together with the
to(bucket)function to fan out a downsampled copy of the data into a second instance in another Availability Zone or Region for a warm standby
The official InfluxDB documentation at https://docs.influxdata.com covers schema design, hardware sizing, and the Flux language in detail.
Step 18: Security Recommendations
InfluxDB serves the HTTP API and the web user interface on the same port, and nginx exposes that same interface on the default HTTP port. The single port model means the security posture of those ports matters more than for most databases. Before taking customer traffic, apply the following:
- Never expose ports 80 or 8086 to the public internet without TLS in front. The web interface, the writes endpoint, and the queries endpoint are all on those ports. Restrict the security group rules to your application subnets and management network.
- Rotate the administrator password using the rotation step above and store the new value in your secrets manager.
- Create per application tokens scoped to the buckets they need, and stop using the initial admin token for application traffic. Only administrative operations should use the admin credential.
- Terminate TLS with the nginx reverse proxy so credentials and data are encrypted in transit.
- Set retention policies on every bucket so that data older than the operationally required window is dropped automatically.
- Back up
/var/lib/influxdbregularly and test restores.
Screenshots
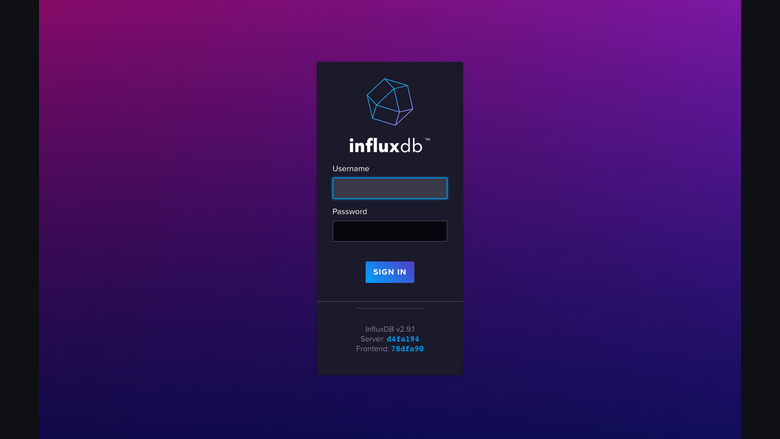
The InfluxDB sign-in page served on the default HTTP port by the nginx reverse proxy, with no manual setup required.
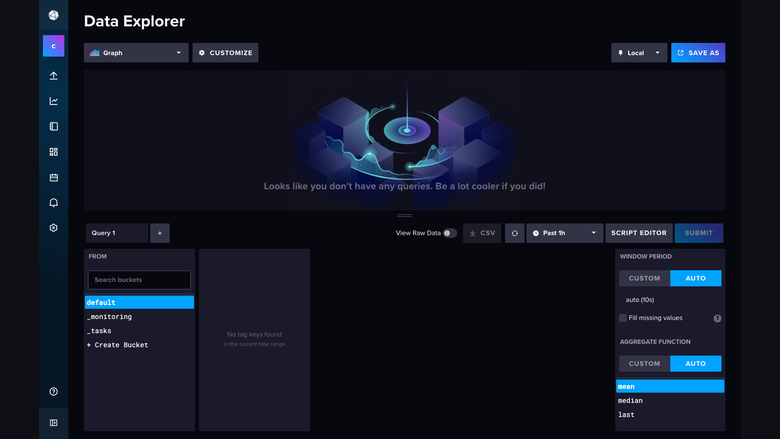
The built-in Data Explorer for composing Flux and InfluxQL queries against the time-series data in the database.
A live InfluxDB dashboard rendering charts over the metrics ingested by the time-series database.
Support
cloudimg provides 24/7/365 expert technical support for this image. Guaranteed response within 24 hours, one hour average for critical issues. Contact support@cloudimg.co.uk.
For general InfluxDB questions, the Flux query language, and schema design, consult the official documentation at https://docs.influxdata.com and the InfluxData community at https://community.influxdata.com.