ELK Stack - Log Analytics and Observability Platform
Overview
Launch a production-ready log analytics platform in minutes. ELK Stack pre-configured with secure credentials, ready for DevOps teams to centralize logs and monitor infrastructure.
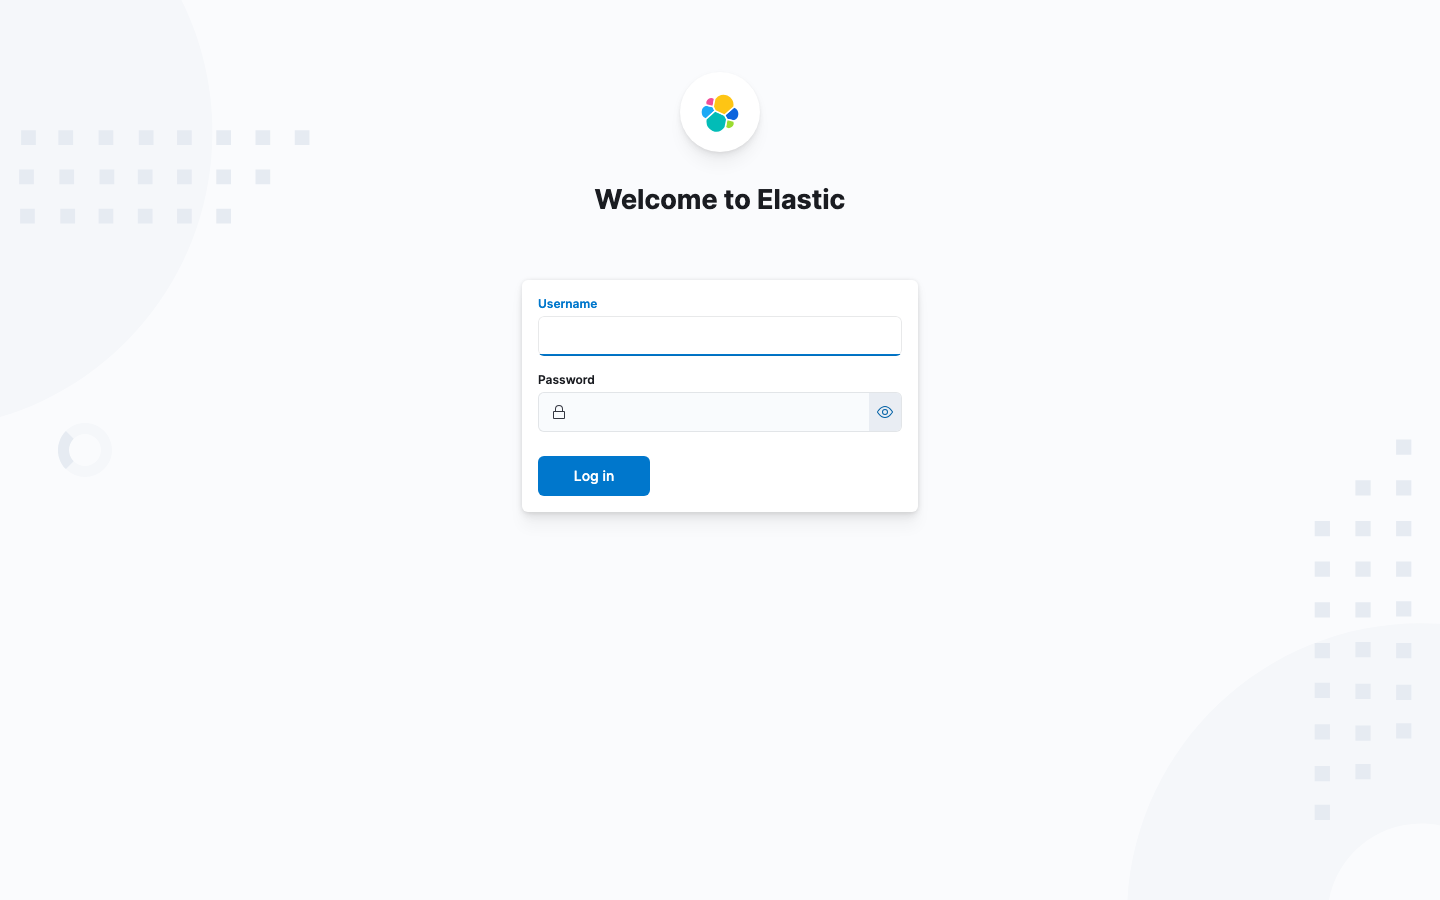
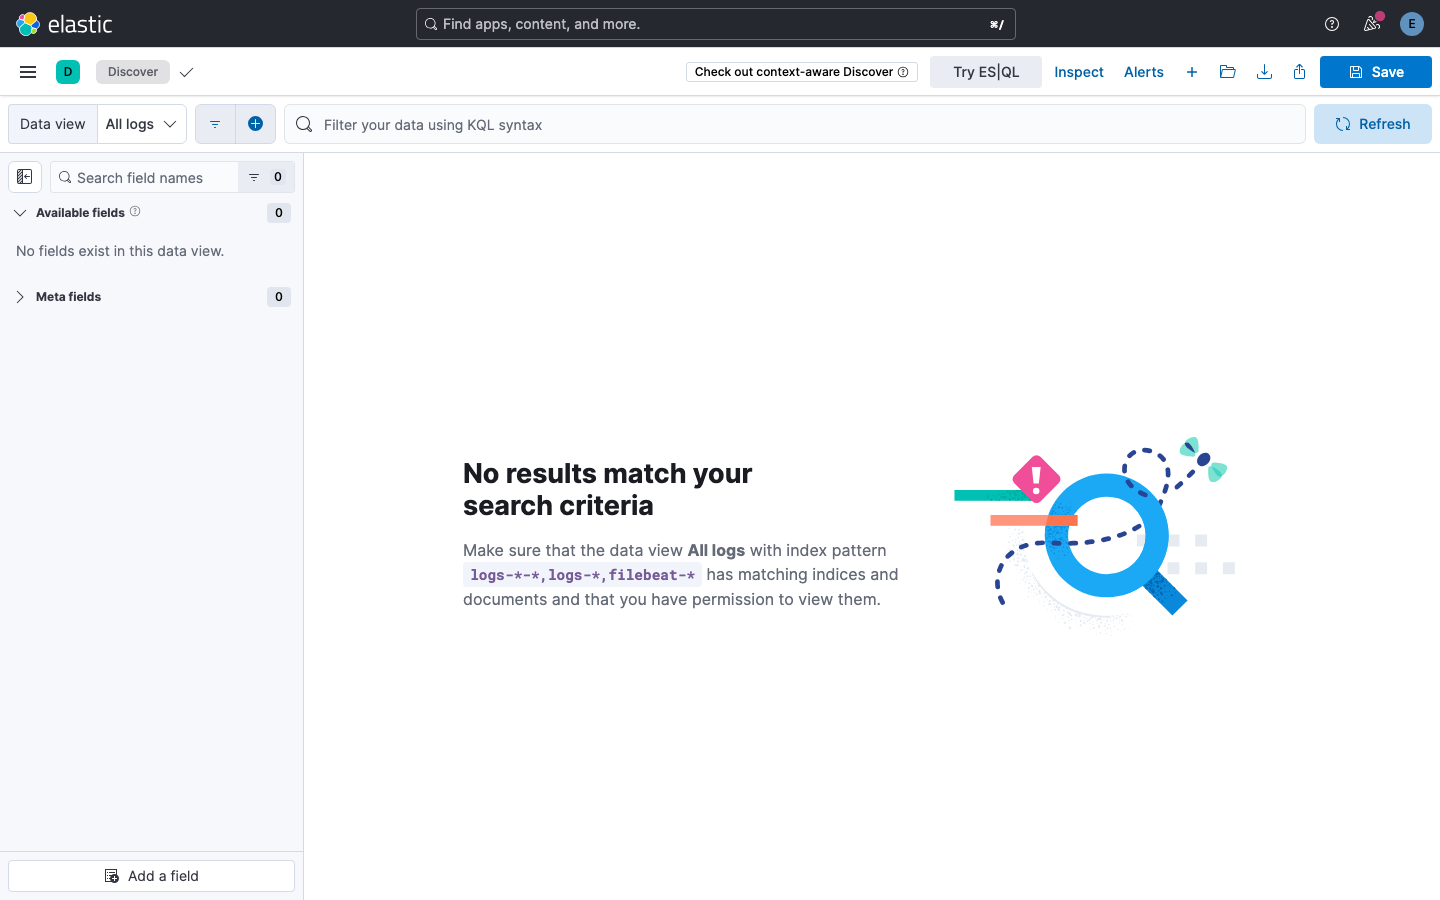
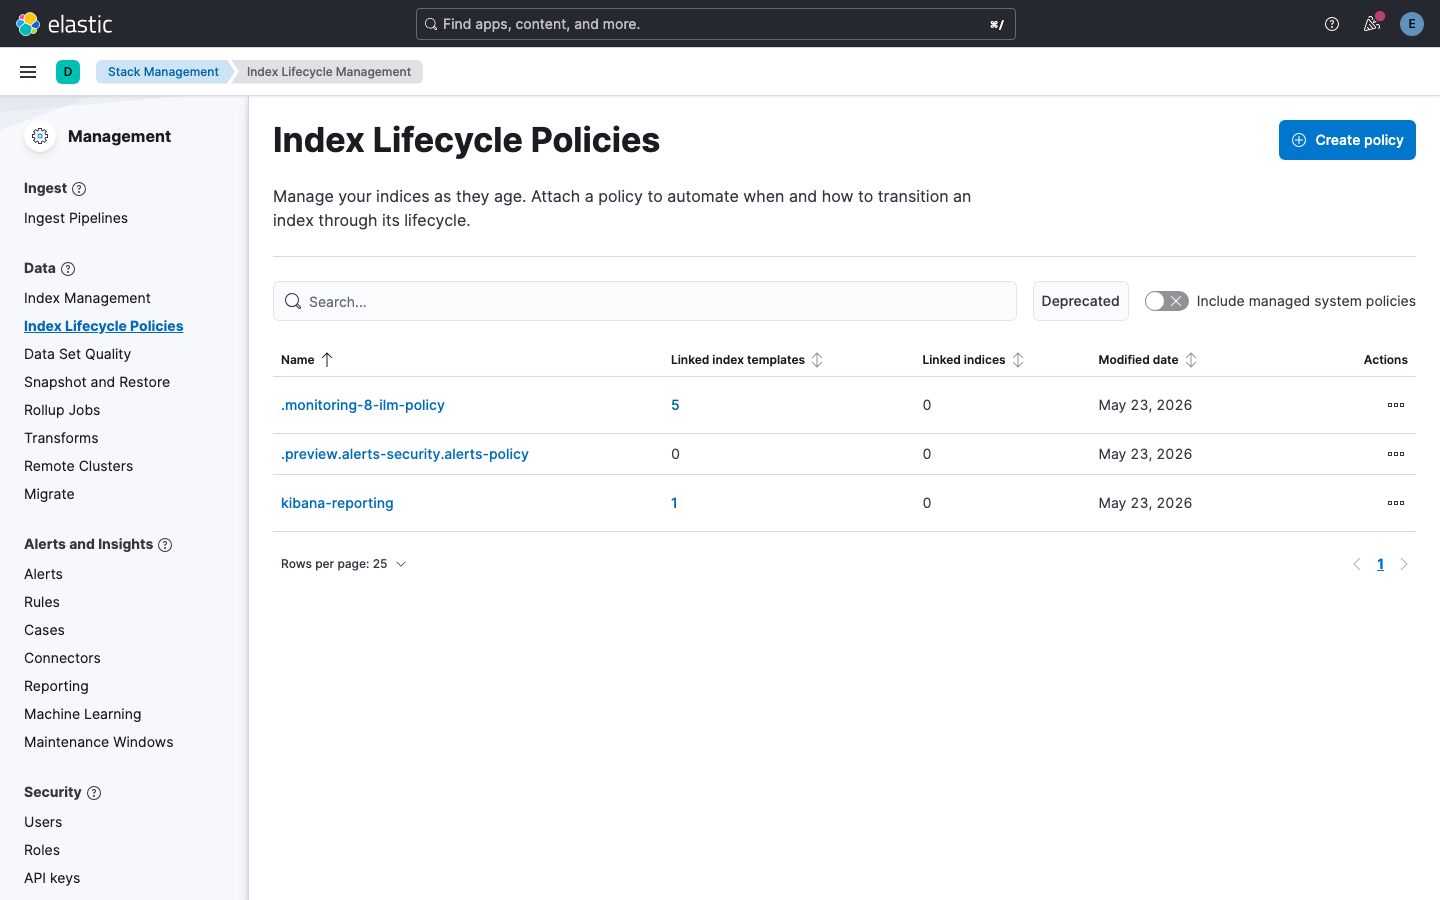
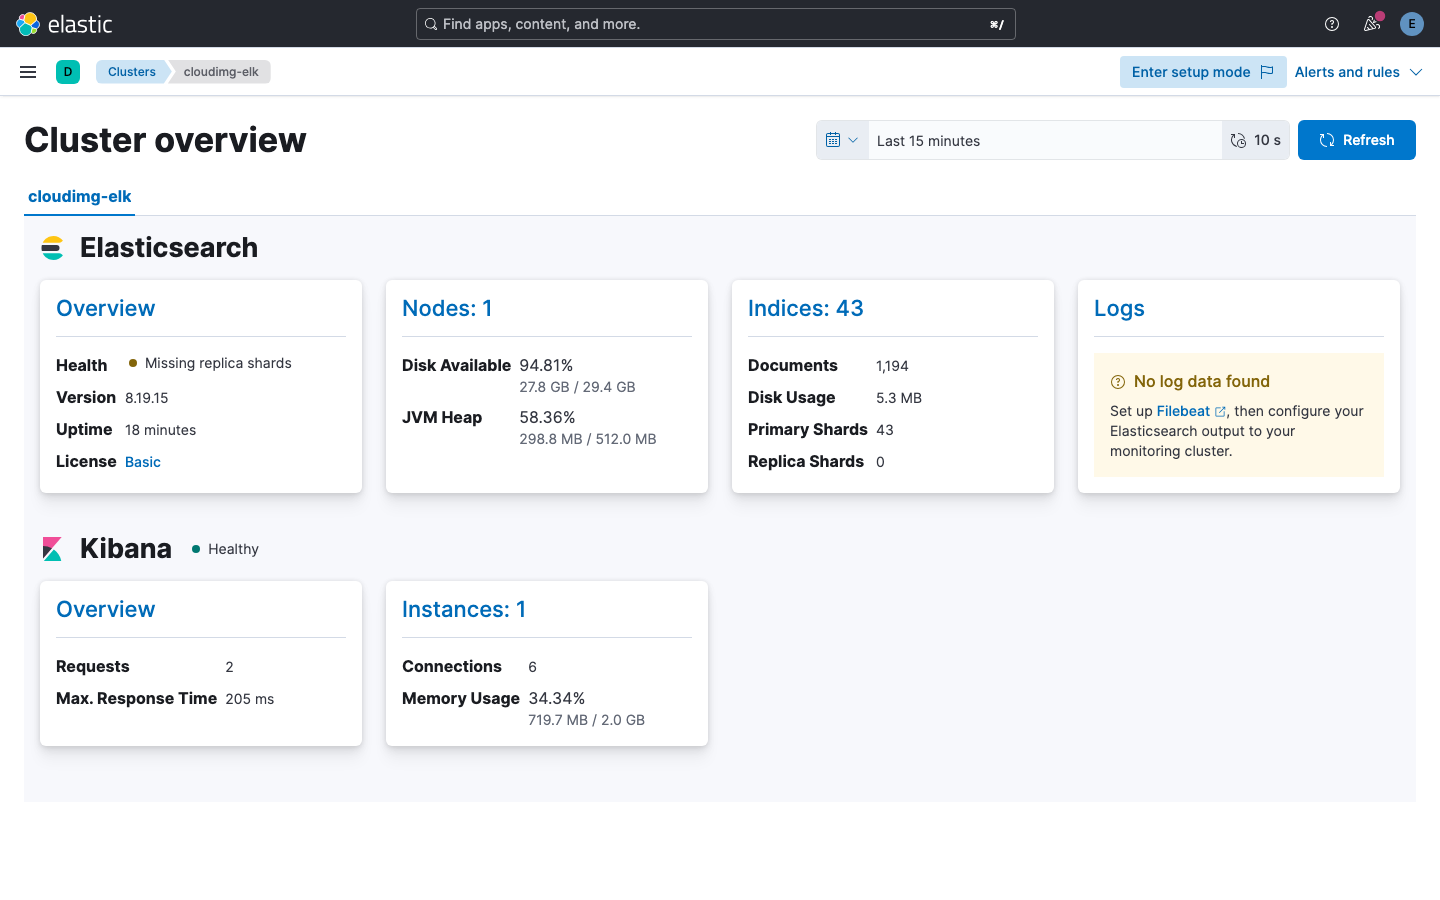
See it running
Real screenshots of this software running on the cloudimg image, taken while testing the deployment guide.
Description
This is a repackaged open source software product wherein additional charges apply for cloudimg support services.
## Stop Spending Days Configuring ELK - Launch a Secure Observability Platform in Minutes
DevOps engineers, SREs, and platform teams need centralized log analytics without weeks of manual setup. This ELK Stack AMI delivers Elasticsearch, Logstash, and Kibana fully installed, configured, and secured on a single EC2 instance - so you go from launch to your first Kibana dashboard in minutes, not days.
## Who This Is For
This AMI is built for startups and SMBs running workloads on AWS who need observability without dedicating a team to manage Elastic clusters. If your team already runs Filebeat or Metricbeat agents on EC2 instances and needs a central destination for logs and metrics, this stack is ready to receive that data immediately after launch.
## What You Get
- Elasticsearch 8.x - Distributed search and storage backend on TCP9200 with TLS encryption enabled by default (Elasticsearch 8.x ships with security on) and HTTP authentication
- Logstash 8.x - Ingestion pipeline with a Beats input on TCP 5044, ready for Filebeat and Metricbeat agents shipping logs from your fleet
- Kibana 8.x - Visual analytics UI on TCP 5601, fronted by nginx reverse proxy on TCP 80 with HTTP basic authentication
- Conservative JVM heaps tuned for a4 GB instance with drop-in configuration files for easy scaling
## Secure by Default
On first boot, a one-shot systemd service automatically rotates the Elasticsearch "elastic" superuser password and generates a fresh nginx basic-auth password - both unique to your instance and written to a root-only file. No shared or default credentials ship in the image. Elasticsearch 8.x TLS is enabled for encrypted client-to-node communication in transit.
Recommended security practices:
- Enable EBS encryption for data at rest
- Place the instance in a VPC private subnet behind an Application Load Balancer
- Restrict security group ingress to ports 80, 5044, and 9200 from trusted CIDR ranges only
## Example Workflow: Centralizing Application Logs
A development team running a web application across multiple EC2 instances can install Filebeat on each node to ship nginx access logs and application logs to this ELK instance on port 5044. Within Kibana, the team builds dashboards tracking request latency, 5xx error rates, and traffic patterns - then configures alerts for anomalies. The entire pipeline from raw log line to visual dashboard requires no additional infrastructure.
## Use Cases
- Centralized log aggregation and full-text search across distributed services
- Infrastructure monitoring and observability with Metricbeat system metrics
- Application performance analytics with latency and error tracking
- Security event analysis and lightweight SIEM for audit trails
- Business analytics and KPI dashboards from structured log data
## AWS Integration
Deploy on any EC2 instance type. Pair with EBS volumes for persistent index storage. Use security groups to control network access. Compatible with AWS Systems Manager for instance management and CloudWatch for host-level monitoring alongside ELK application metrics.
## cloudimg 24/7 Support
Every subscription includes expert technical support from cloudimg engineers available around the clock via email and live chat. Get help with ELK deployment, ingestion pipeline authoring, index lifecycle management, Kibana dashboard creation, and performance tuning. Critical issues receive a one-hour average response time.
## Get Started
Launch the AMI, SSH into your instance, retrieve your unique credentials from the root-only file, and browse to your instance IP to access Kibana. Point your Beats agents at port 5044 and start exploring your data.
Elasticsearch, Logstash, Kibana and ELK are trademarks of Elasticsearch B.V. All other product and company names are trademarks or registered trademarks of their respective holders. Use of them does not imply any affiliation with or endorsement by them.
Key Features
- ELK Stack preinstalled and ready as a single-node observability platform, with Elasticsearch, Logstash and Kibana and no manual setup required
- Hardened first boot rotates the Elasticsearch elastic password and generates a fresh Kibana basic-auth password for every instance, stored in a file only the root user can read
- 24/7 technical support from cloudimg, with expert assistance for ELK deployment, ingestion pipelines, index lifecycle management and dashboard authoring
Related Technologies
Related Products
Alma Linux 8
Migrate from CentOS 8 EOL to Alma Linux 8 in under 60 seconds with zero licensing fees. 1:1 RHEL 8 compatible, AWS-optim...
Oracle Database 21c Standard Edition - Windows
The SQLPlus utility is available as a shortcut on the Desktop. Double click the SQL Plus* icon to open it.
Windows Server 2022
Once the instance has passed both status checks (2/2), retrieve the Administrator password. Allow 4 to 5 minutes after l...
Windows Server 2025 Datacenter
Once the instance has passed both status checks (2/2), retrieve the Administrator password. Allow 4 to 5 minutes after l...

Grafana Loki Log Aggregation
This image runs Grafana Loki, the open source log aggregation system from Grafana Labs, fully installed and configured.
Jaeger Distributed Tracing
The image runs the jaeger-all-in-one binary (Jaeger 1.x) as a systemd service, with the embedded Badger key-value store ...