Jaeger Distributed Tracing
Overview
Jaeger, the open source distributed tracing platform, preinstalled with the Jaeger Query UI fronted by nginx HTTP basic authentication and an OTLP receiver ready for application spans. A per instance UI password is generated on first boot. Backed by 24/7 cloudimg support.
See it running
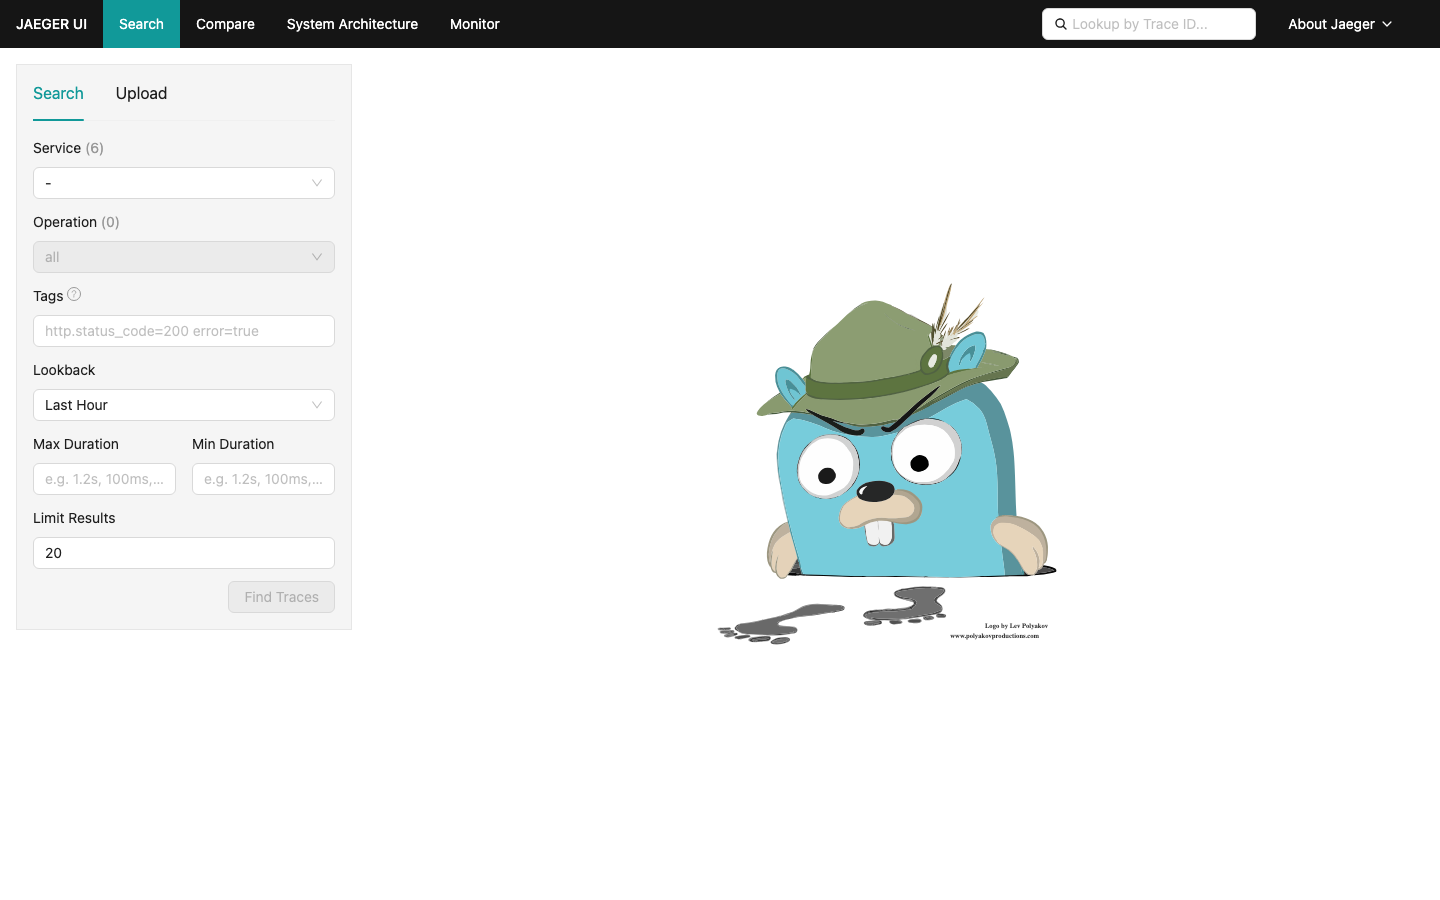
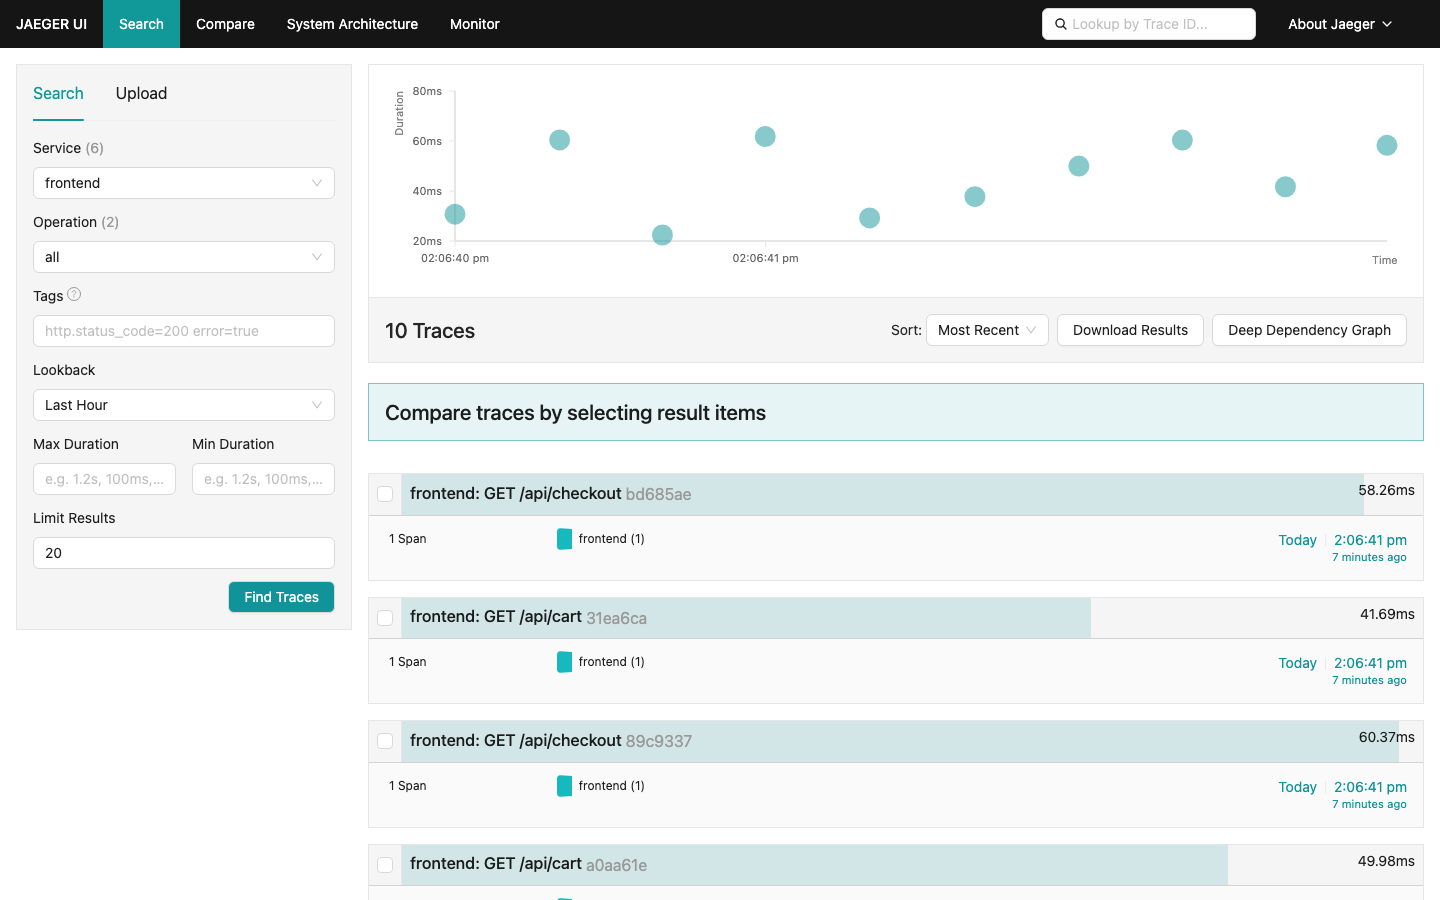
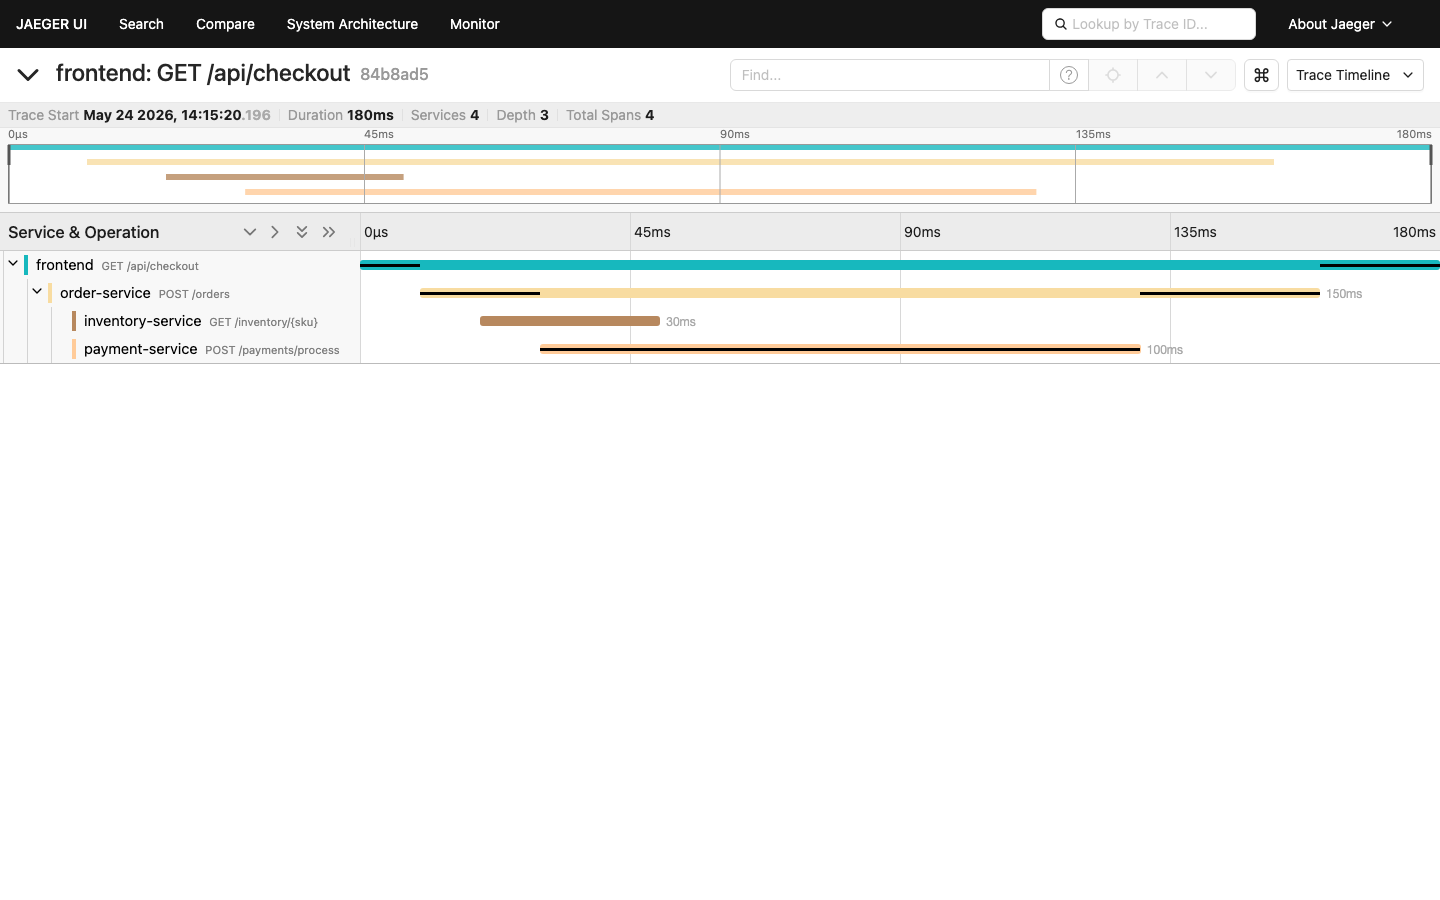
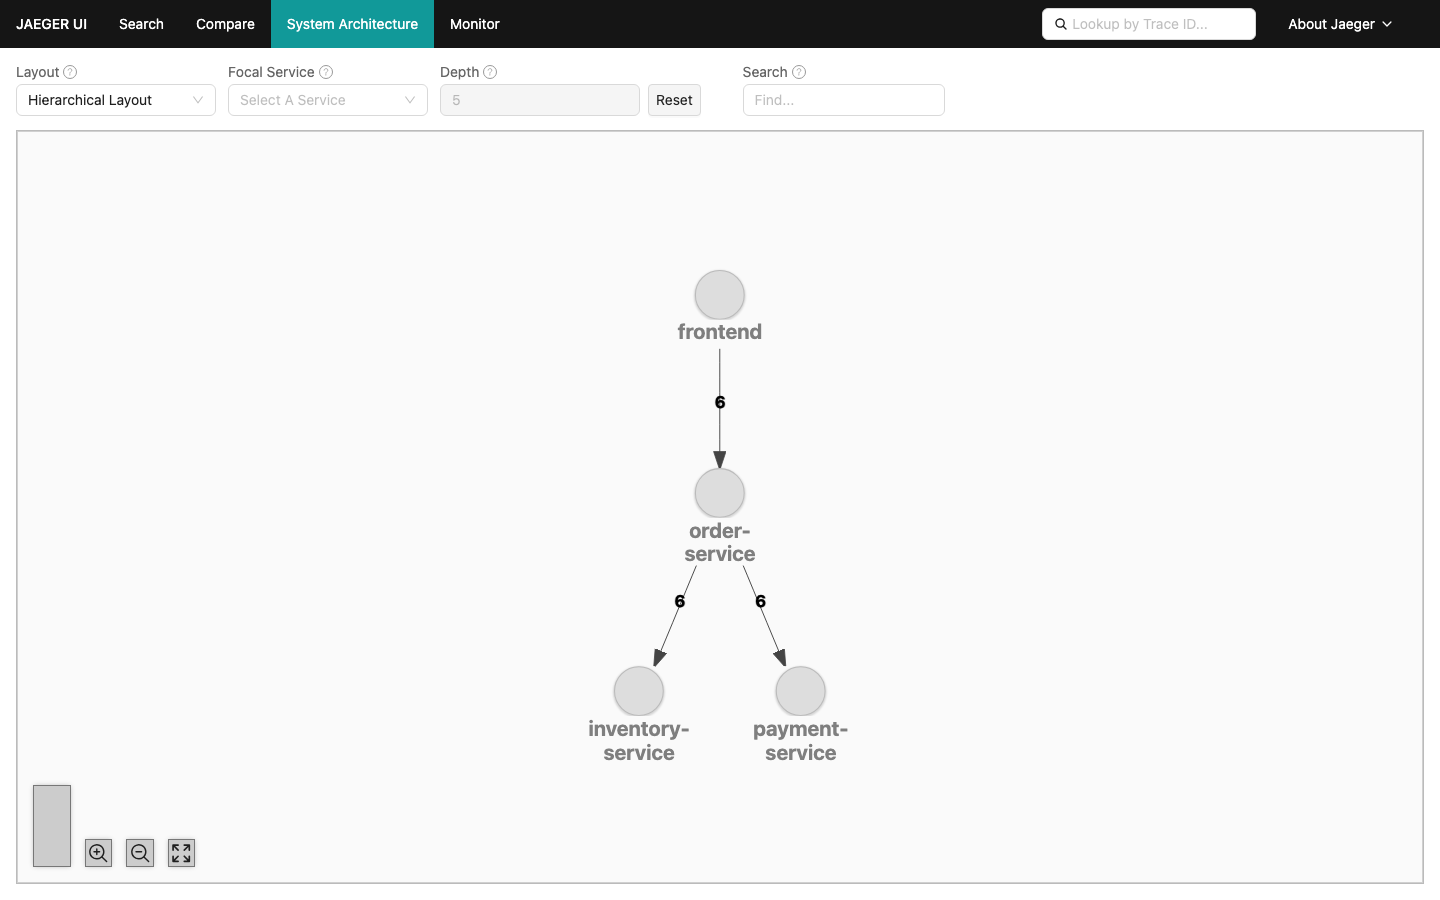
Real screenshots of this software running on the cloudimg image, taken while testing the deployment guide.
Description
This is a repackaged open source software product wherein additional charges apply for cloudimg support services.
Overview
Jaeger is the open source distributed tracing platform that lets you follow a single request across every microservice it touches, surface latency hotspots, and visualise service-to-service dependencies. It is a graduated project of the Cloud Native Computing Foundation and is licensed under the Apache License 2.0. This image delivers Jaeger as a fully installed and configured all-in-one deployment, so a complete tracing back end is running within minutes of launch. The current release available is the Jaeger 1.x series.
Tracing Stack
The jaeger-all-in-one binary runs as a systemd service combining the collector, the storage back end and the query UI in one process. Application spans arrive over the OpenTelemetry Protocol on both gRPC (port 4317) and HTTP (port 4318), as well as on the legacy Jaeger collector port (14268), and are persisted to an embedded Badger key value store on the dedicated data volume. The Jaeger Query UI is fronted by an nginx reverse proxy on port 80 with HTTP basic authentication.
Secure First Boot
On the first boot of your instance a one shot service generates a fresh UI administrator password, unique to that instance, writes it as an nginx htpasswd entry, and stores the plain text value in a root only file. No shared or default credentials ship in the image.
Ready To Use
The Jaeger service, the nginx reverse proxy, the storage directory and the authentication credentials are all prepared. Point any OpenTelemetry SDK at the OTLP endpoint, browse to the instance address on port 80 to reach the Jaeger Query UI, and start exploring traces. Badger trace data lives on a dedicated, independently resizable data disk.
cloudimg Support
24/7 technical support by email and chat. Help with Jaeger deployment, OpenTelemetry instrumentation, sampling and retention tuning, and integrating Jaeger with the rest of your observability stack.
Use Cases
Distributed tracing for microservices. Latency root cause analysis. Service dependency mapping. Performance regression detection in continuous delivery pipelines. Observability back end for OpenTelemetry instrumented applications.
All product and company names are trademarks or registered trademarks of their respective holders. Use of them does not imply any affiliation with or endorsement by them.
Key Features
- Jaeger all-in-one preinstalled and ready, with the Jaeger Query UI on port 80, OTLP gRPC and HTTP receivers, and the embedded Badger storage back end already configured
- Hardened first boot generates a fresh UI password for every instance and stores it in a file only the root user can read, with nginx HTTP basic authentication enforced on the Jaeger Query UI
- 24/7 technical support from cloudimg, with expert assistance for distributed tracing, OpenTelemetry instrumentation, sampling tuning and observability integrations
Related Technologies
Related Products
Alma Linux 8
Migrate from CentOS 8 EOL to Alma Linux 8 in under 60 seconds with zero licensing fees. 1:1 RHEL 8 compatible, AWS-optim...
ELK Stack - Log Analytics and Observability Platform
This image runs the full ELK Stack as a single node deployment. Elasticsearch is the distributed search and analytics en...
Oracle Database 21c Standard Edition - Windows
The SQLPlus utility is available as a shortcut on the Desktop. Double click the SQL Plus* icon to open it.
Windows Server 2022
Once the instance has passed both status checks (2/2), retrieve the Administrator password. Allow 4 to 5 minutes after l...
Windows Server 2025 Datacenter
Once the instance has passed both status checks (2/2), retrieve the Administrator password. Allow 4 to 5 minutes after l...

Grafana Loki Log Aggregation
This image runs Grafana Loki, the open source log aggregation system from Grafana Labs, fully installed and configured.