Base
Hardened build
minimal ports, security patches applied at build time

Gatus, an automated health and uptime monitoring dashboard and status page driven by one declarative YAML list of the endpoints you want to watch.
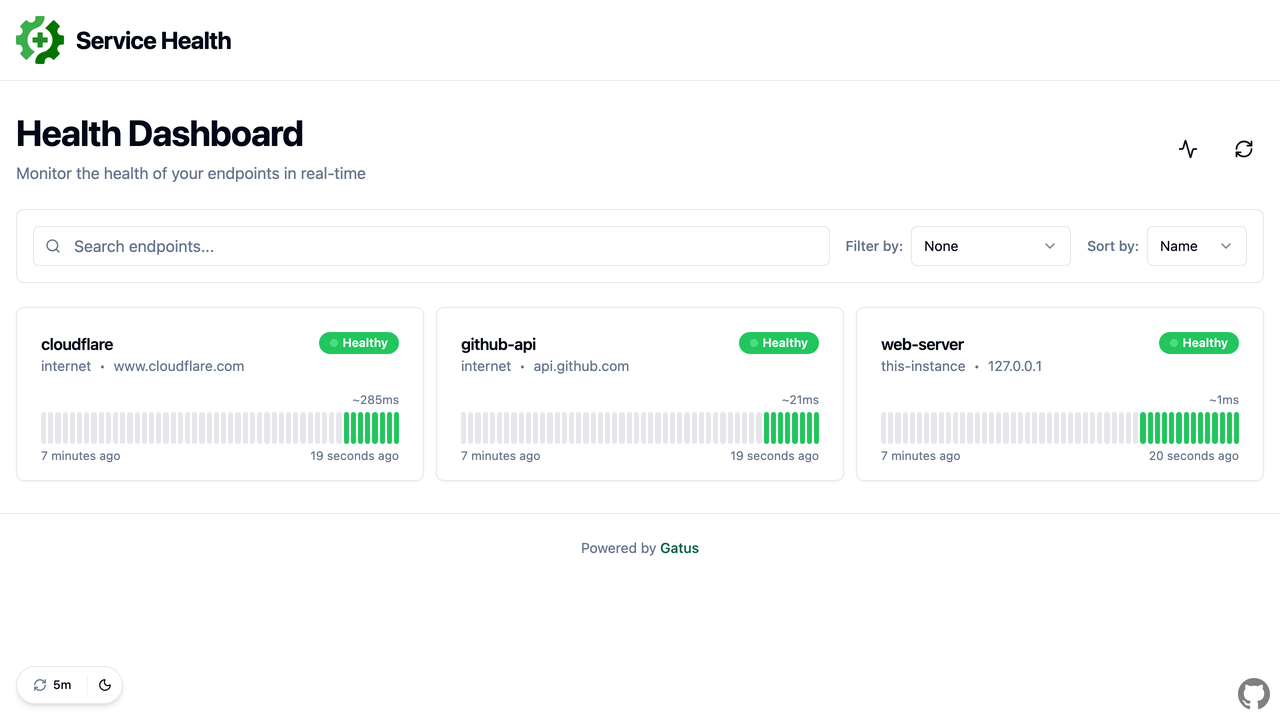
Gatus is an automated health and uptime monitoring dashboard and status page. You describe the services you want to watch as a short list of endpoints in a single YAML file, each with its own check interval and success conditions, and Gatus continuously probes them and renders a clear, real time status page showing what is up, what is down and how each service has behaved over time. Conditions are expressive, covering HTTP status, response time, response body, DNS answers and TLS certificate expiry across HTTP, TCP, ICMP, DNS and other protocols, and results are also available as a JSON API.
It suits teams that want a lightweight, self hosted status page and uptime monitor for their own services and dependencies, with the whole configuration living in one declarative file that is easy to version control.
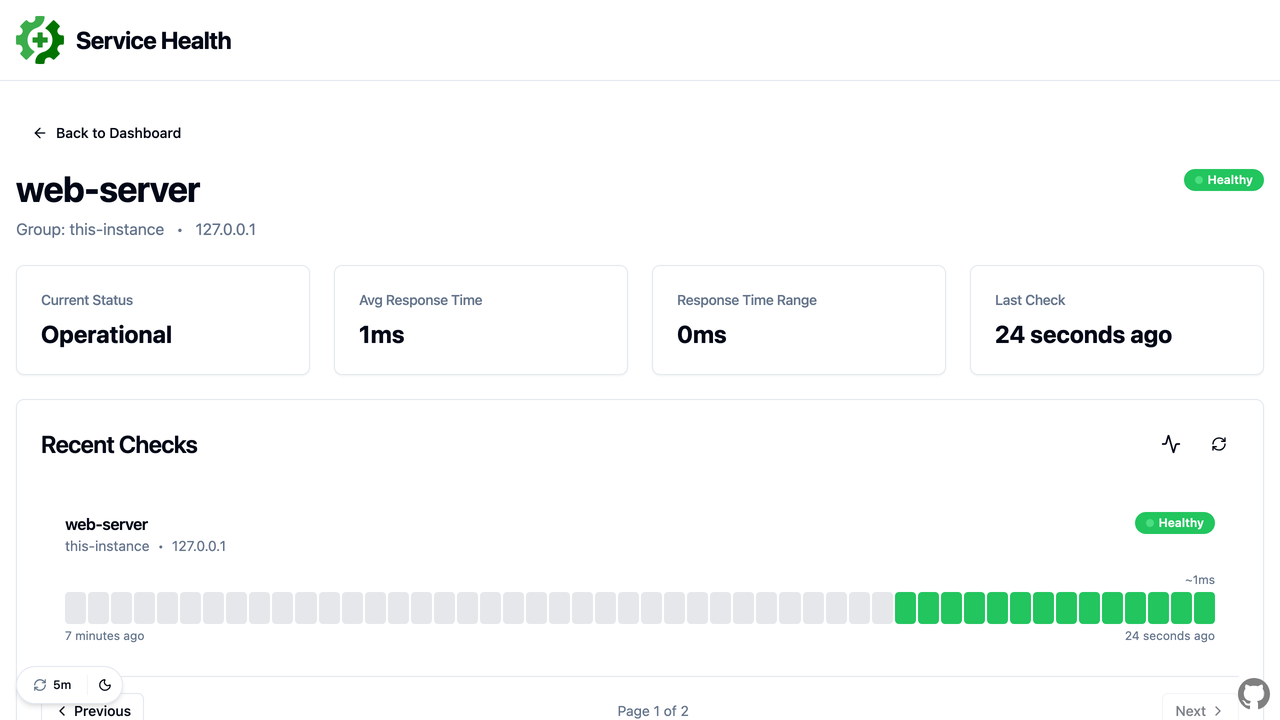
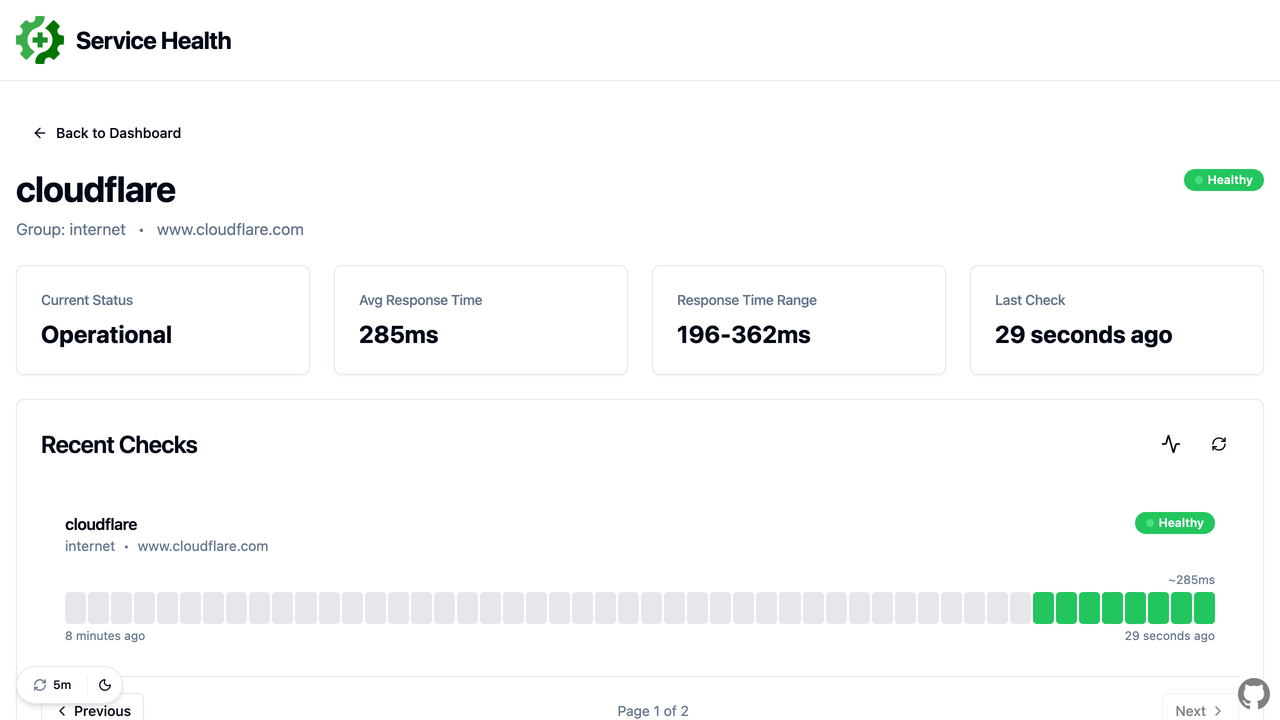
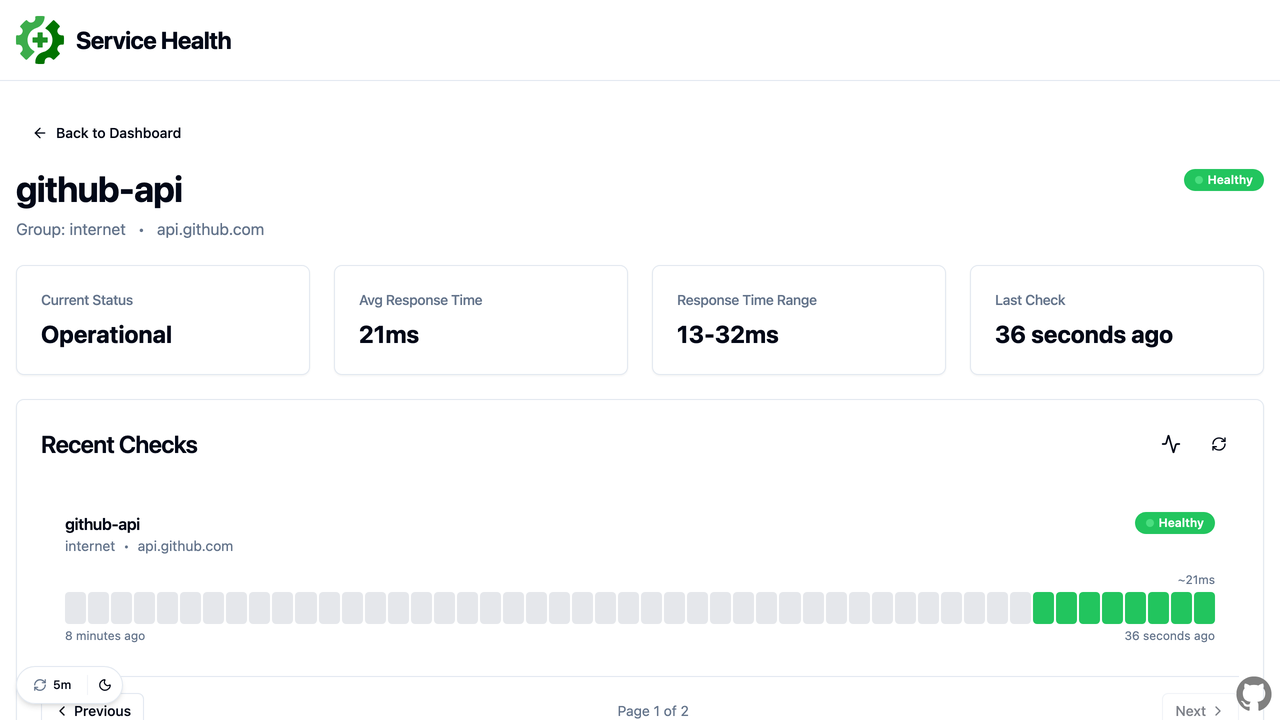
cloudimg delivers Gatus fully installed behind an nginx reverse proxy, so a live status page answers the moment the instance boots. The image is secure by default: Gatus binds only to loopback, the dashboard is read only by design so there is no web admin surface and no login to manage, no credential of any kind is baked into the image, and the Prometheus metrics endpoint is disabled so nothing beyond the intended dashboard and JSON API is exposed. A sensible default configuration monitors the instance's own web server and a couple of well known public endpoints so the dashboard is populated on first boot. The base is fully patched with unattended security upgrades enabled, and every deployment is paired with a step by step deploy guide and backed by 24/7 cloudimg support.
Real screenshots taken while testing this image against its deployment guide.

Apache HertzBeat is an open source, real time monitoring and alerting system from the Apache Software Foundation.

AWStats on Ubuntu 24.04 LTS preconfigured machine image for Microsoft Azure, hardened and verified with 24/7 support by ...

Checkmate (by BlueWave Labs) is an open source uptime, infrastructure and incident monitoring platform.
The cloudimg image ships the free and open source, AGPL-3.0 licensed Gigapipe 5.4.4 release, installed from the project'...

This image runs Glances 4.5.5, an open source cross platform system monitor, on Ubuntu 24.04 LTS.

This image runs GoAlert 0.34.1, the open source on-call scheduling and alerting platform maintained by Target, on Ubuntu...