Base
Hardened build
minimal ports, security patches applied at build time

Cloudprober, an open source active monitoring tool that continuously probes your services over HTTP, PING, DNS, TCP, and gRPC and exports availability and latency metrics in Prometheus format.
Cloudprober is an open source active, black box monitoring tool. Instead of waiting for an outage to be reported, it continuously probes your endpoints on a schedule over HTTP, HTTPS, PING, DNS, TCP, gRPC, and external commands, and turns the results into availability and latency time series you can alert on. Its entire behaviour is composed from a single readable config file: each probe block picks a type, a set of targets, and an interval, and Cloudprober exports the standard success, total, and latency metrics for every probe in Prometheus format on a built in web server, alongside a live status page. There is no database and no console to administer, so your monitoring configuration lives in version controllable text.
The cloudimg image is hardened and fully patched with Cloudprober preconfigured behind nginx TLS, its status page and metrics endpoint bound to loopback and fronted by HTTP basic auth so the monitoring surface is never exposed. It ships secure by default with no shared credentials: on first boot every instance generates its own basic authentication password and its own TLS certificate and writes the per instance credentials to a root only file. A demonstration probe monitors the instance itself so metrics flow the moment it boots, and every instance is backed by a paired deploy guide and 24/7 cloudimg support.
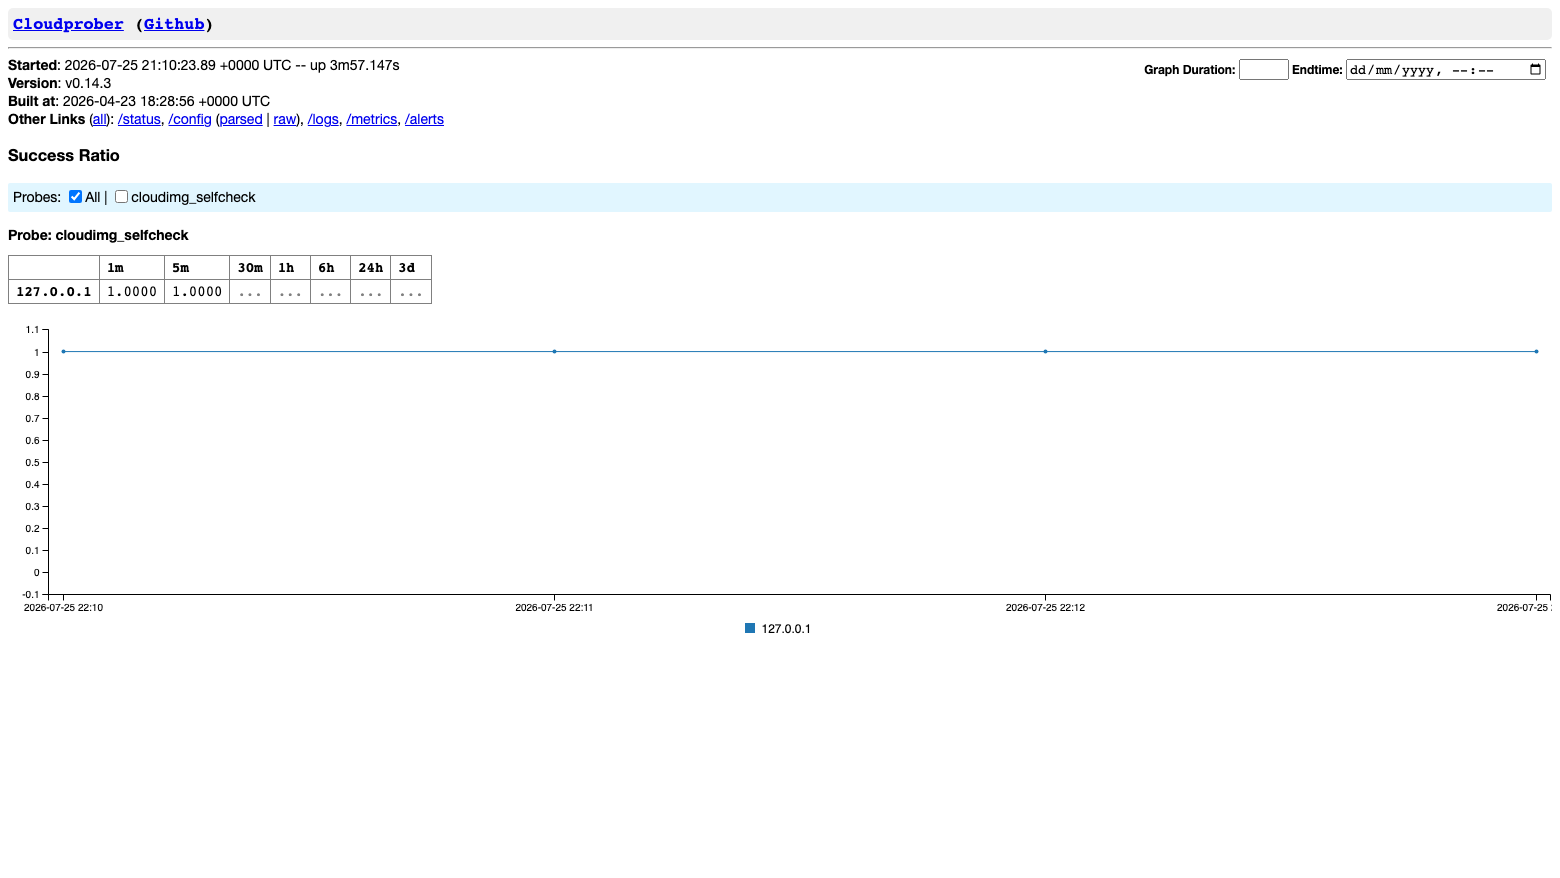
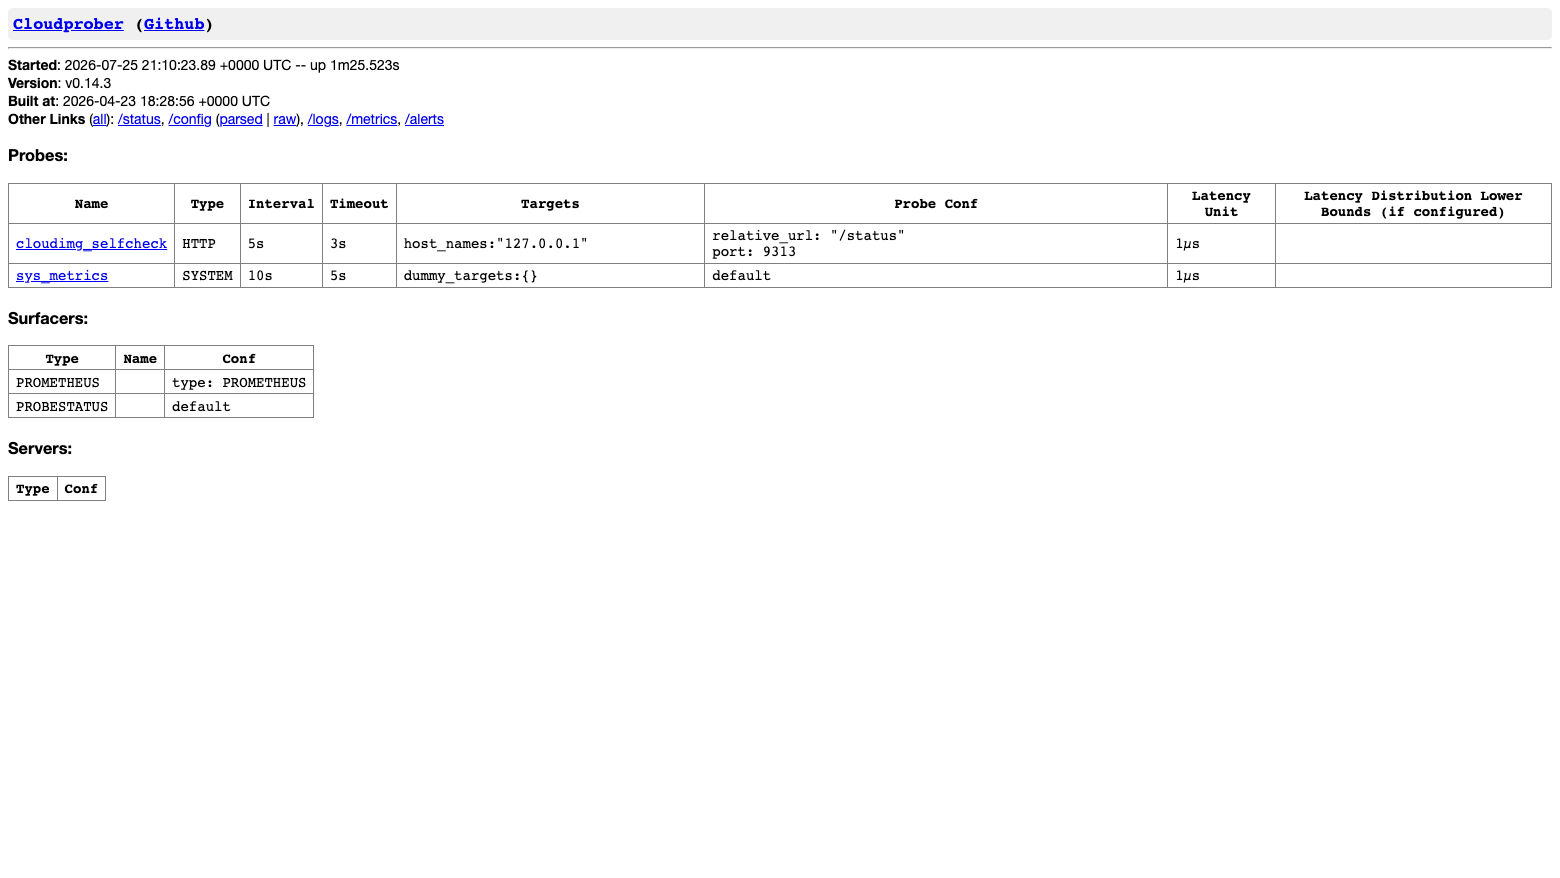
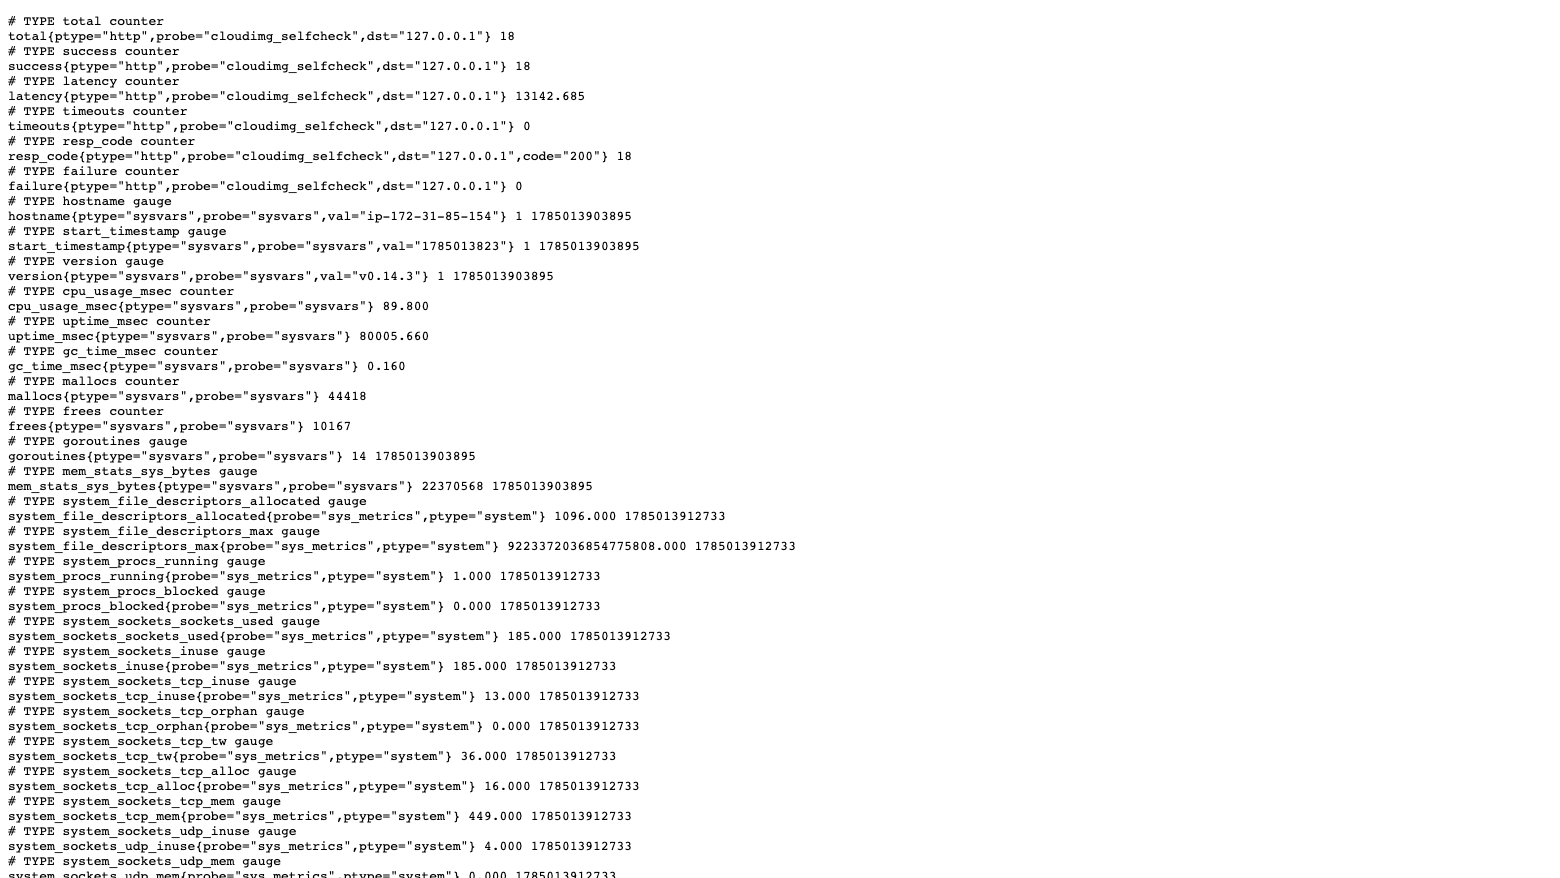
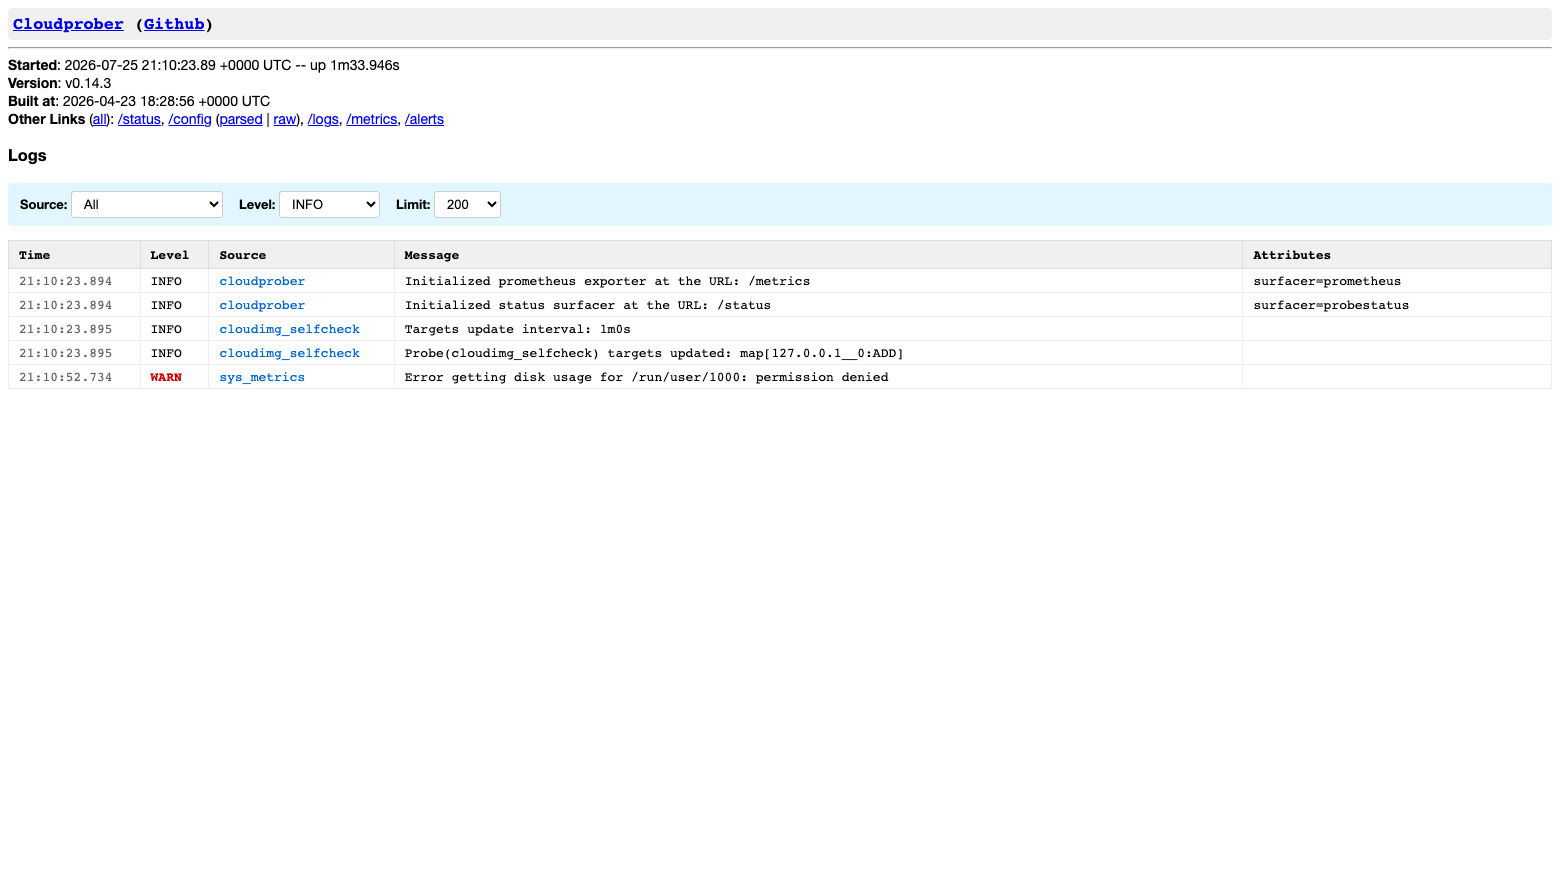
Real screenshots taken while testing this image against its deployment guide.
This is a repackaged open source software product wherein additional charges apply for cloudimg support services.
## Why This AMI Instead of Self-Managed Cloudprober
If you install Cloudprober from source, you get a powerful prober with no authentication on its HTTP surface, no TLS termination, and manual systemd configuration ahead of you. If you use a SaaS uptime monitor, you pay per-probe pricing and lose control over your vantage point. This image eliminates both trade-offs: you get a fully hardened, production-ready Cloudprober instance that exports Prometheus metrics within minutes of launch, with unique per-instance credentials and TLS termination handled for you.
## Who This Is For
SRE teams, platform engineers, and DevOps leads running microservices on AWS who need active black box monitoring from a controlled vantage point. If your stack already includes Prometheus and Grafana, this AMI slots directly into your existing alerting pipeline.
## How It Works
Cloudprober continuously probes your endpoints on a schedule over HTTP, HTTPS, PING, DNS, TCP, gRPC, and external commands, then turns results into availability, success ratio, and latency time series. You describe targets and probes in a single textproto configuration file at /etc/cloudprober.cfg, and Cloudprober exports standard success, total, and latency metrics in Prometheus format.
## Example Deployment Scenario
An SRE team monitoring 50 microservice health endpoints across multiple availability zones configures one probe block per service in /etc/cloudprober.cfg, sets a 5-second interval, and scrapes the metrics endpoint into their existing Prometheus instance. When a service becomes unreachable, the success ratio drops immediately, so their own alerting pipeline can page within seconds of failure, without waiting for a customer report.
## Secure by Default - No Shared Credentials
This image never exposes Cloudprober's HTTP surface to the network. Cloudprober binds to loopback only, and on first boot the instance generates its own unique HTTP basic authentication password and its own self-signed TLS certificate, then writes them to a root-only credentials file. No secret is baked into the image, so no two instances ever share a credential. An unauthenticated request to the status page or metrics is rejected, while a separate unauthenticated health endpoint is available for load balancer probes.
## Ready to Use on First Boot
The image ships a demo probe that monitors the instance's own status endpoint, so the full probe-to-surfacer-to-metrics pipeline is exercised and reporting success the moment the instance comes up with no external dependency. From there you edit one config file to add probes for your own targets, restart the service, and scrape the metrics endpoint into Prometheus, Grafana, or any Prometheus-compatible alerting stack.
## Application Architecture
## Getting Started
1. Launch the AMI and allow inbound TCP 443 in your security group
2. SSH into the instance and retrieve your generated credentials from the root-only credentials file
3. Access the status page at https://your-instance-ip to verify the demo probe is reporting
4. Edit /etc/cloudprober.cfg to add probes for your own targets
5. Restart the service and point your Prometheus scrape config at the metrics endpoint
## Built and Verified by cloudimg
Every cloudimg image is built from the official upstream release, checksum verified at build time, fully patched, and verified working end to end before publication. Backed by 24/7 cloudimg support via email and live chat.
The image builds the official 3proxy binary (pinned at build from the upstream release) and runs it under systemd as the...
The image builds accel-ppp 1.14.0 from the upstream source tag (commit 048d31cb, dated 25 January 2026), verified agains...

This image runs AdGuard Home, the open source network-wide DNS server that blocks ads, trackers and malicious domains fo...
The image installs the latest stable Anubis release, resolved at build time from the official GitHub release package and...

This image runs Apache Guacamole, the open source clientless remote desktop gateway.

This image runs Apache ShenYu, the high performance, reactive open source API gateway built on Java and Spring WebFlux.