Base
Hardened build
minimal ports, security patches applied at build time

Grafana 12 OSS, the observability platform for metrics, logs, and traces, ready to build dashboards from first boot.
Grafana is an open source observability platform for querying, visualising, and alerting on metrics, logs, and traces from many data sources. It is used to build operational dashboards and monitor systems and applications.
cloudimg ships Grafana hardened and fully patched on Ubuntu 24.04 LTS, preconfigured so the web interface is live on first boot. A unique administrator credential is generated on first boot with no default login, and 24/7 support backs the image.
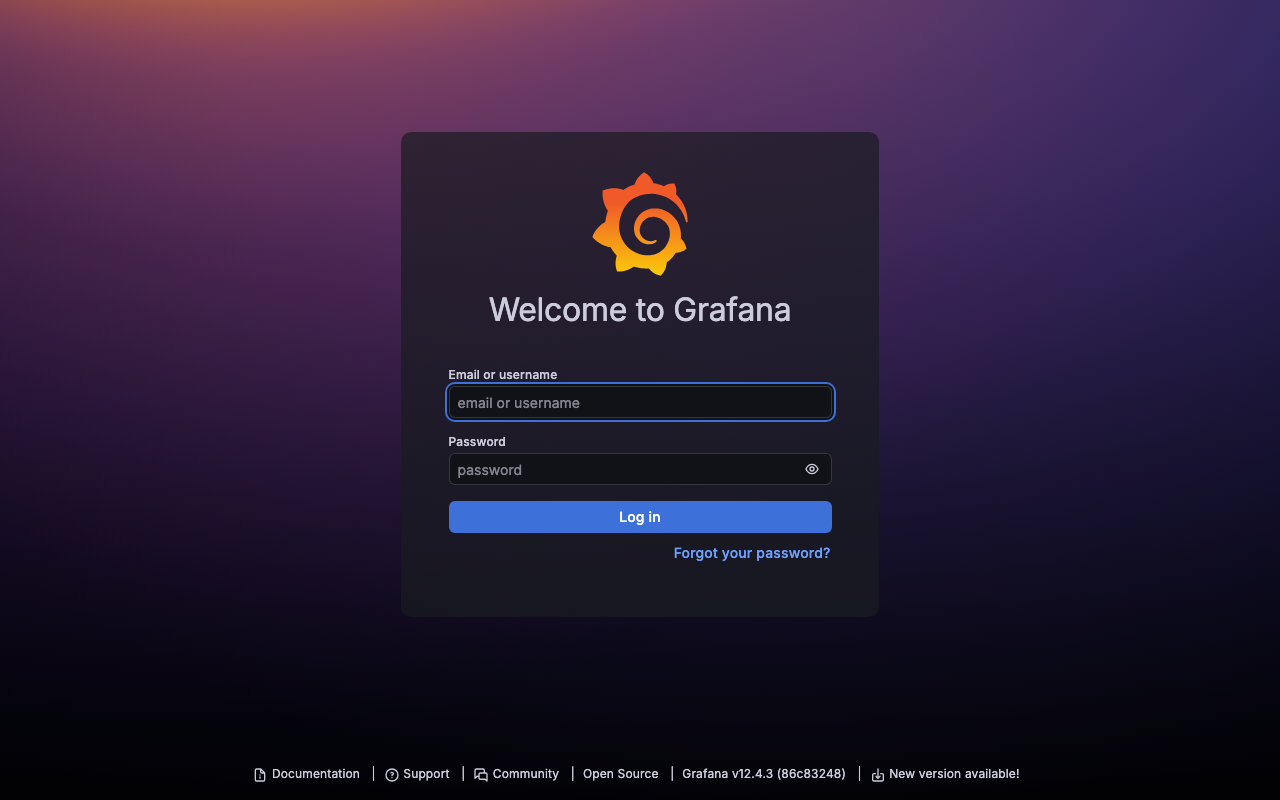
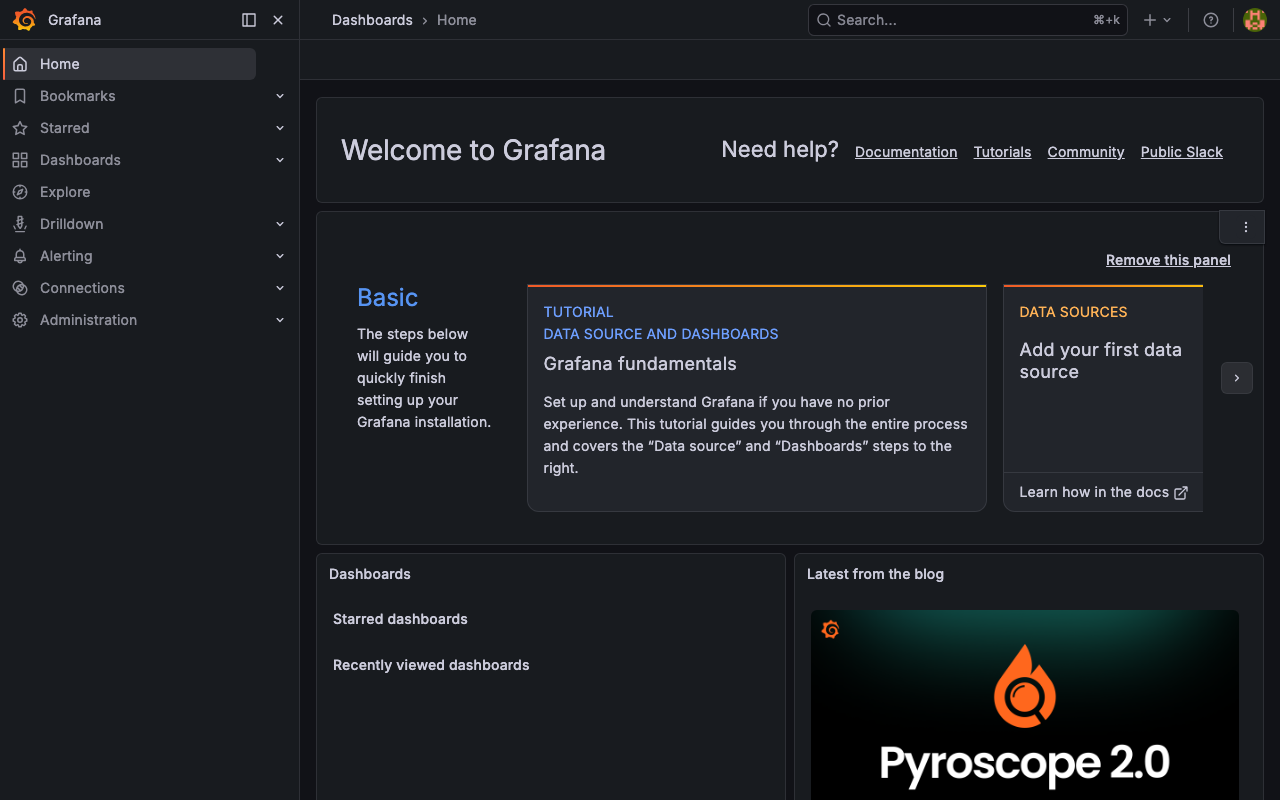
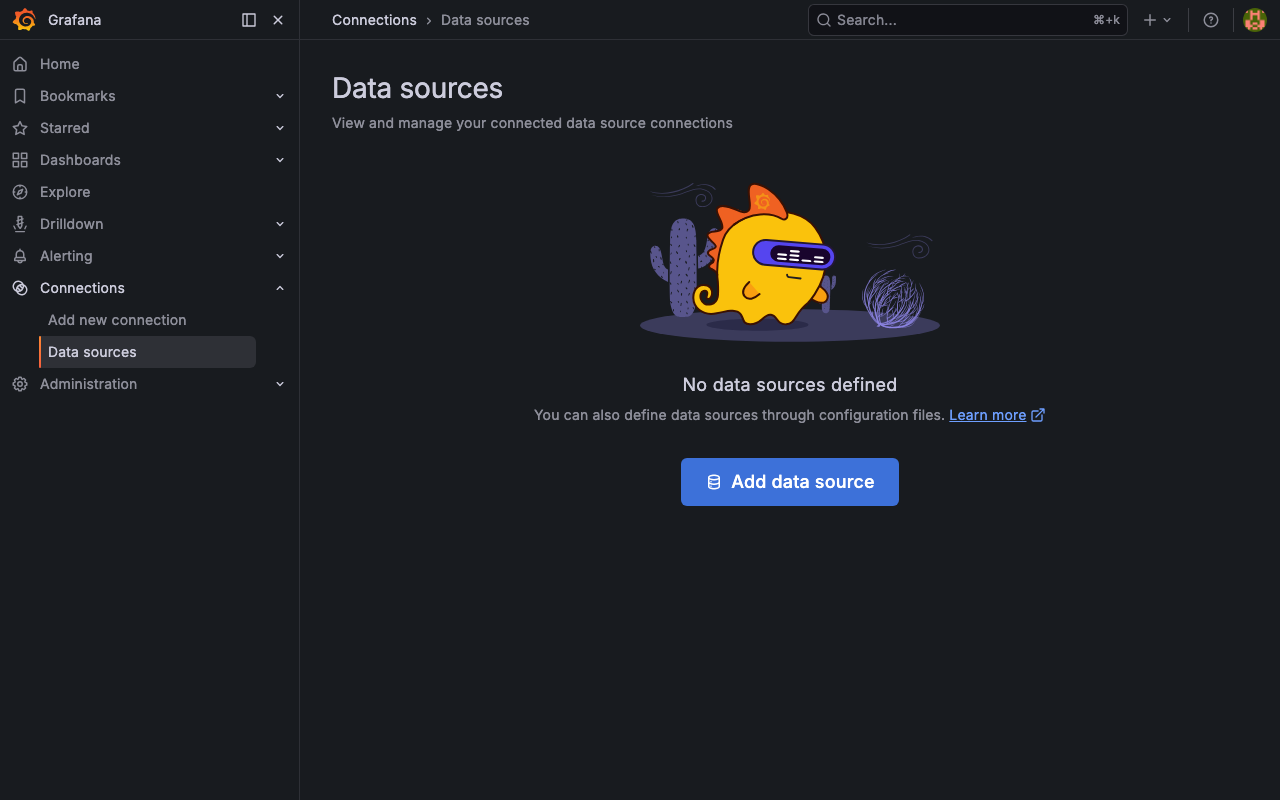
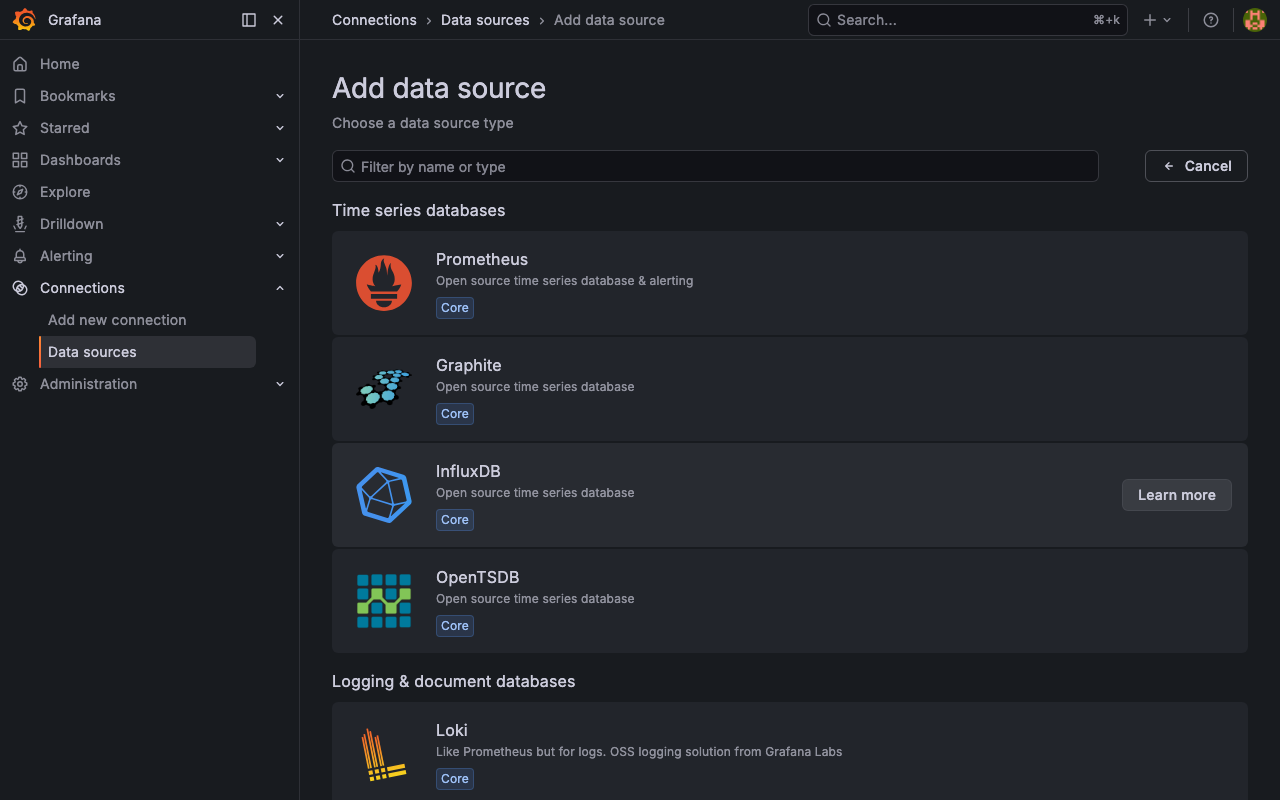
Real screenshots taken while testing this image against its deployment guide.

Docker Community Edition is the free, open source container runtime that allows you to package applications and their de...
Docker Community Edition preconfigured across several Linux variants, running containers within minutes of launch.

Around that core it adds a side by side editor with comments and a review state for each key, conflict detection when a ...
Apache Allura is the open source project hosting platform, or forge, that powers SourceForge.

This image runs Altair GraphQL Client 8.5.7, an open source GraphQL IDE, on Ubuntu 24.04 LTS.

A control node is the machine those playbooks actually run from. This image is that machine, and it ships ready rather t...