Base
Hardened build
minimal ports, security patches applied at build time

Jaeger with OpenTelemetry Collector is a complete tracing pipeline in one instance, where an OpenTelemetry Collector receives your applications' telemetry and Jaeger stores it and shows you the traces.
Jaeger with OpenTelemetry Collector pairs the two halves of an open source distributed tracing stack so they work as one pipeline rather than two products you have to wire together. Instrumented applications send OTLP telemetry to the OpenTelemetry Collector, which is the vendor neutral ingest tier: it accepts spans from many languages and frameworks, enriches them with resource attributes, protects the backend with memory limiting and batching, and forwards everything on to Jaeger. Jaeger then stores the traces in an embedded local store and serves the trace search and dependency views that engineers actually use to find a slow or failing request. Keeping the collector in front of the backend is the shape the OpenTelemetry project recommends, because it decouples your applications from the tracing backend: instrumentation points at one stable endpoint, and the processing tier absorbs bursts and shapes data before it reaches storage.
cloudimg ships the collector and the tracing backend already joined into a working pipeline and proves it before release: a span is pushed into the collector and read back out of the trace UI on every build, so an instance that boots is an instance that carries telemetry end to end. The image is secure by default rather than left open as both projects ship: the trace interface is served over TLS behind a unique administrator credential generated on the instance itself, telemetry ingest also requires a unique per instance credential instead of accepting anonymous spans, the backend and every debug, health and metrics endpoint are bound to the loopback interface, and the services refuse to start at all until that per instance bootstrap has run, so no published or example credential can ever be in effect. Trace storage is embedded and local, so the instance runs standalone with no external database to provision. The base is fully patched with unattended security upgrades enabled, and every deployment is paired with a step by step deploy guide, backed by 24/7 cloudimg support.
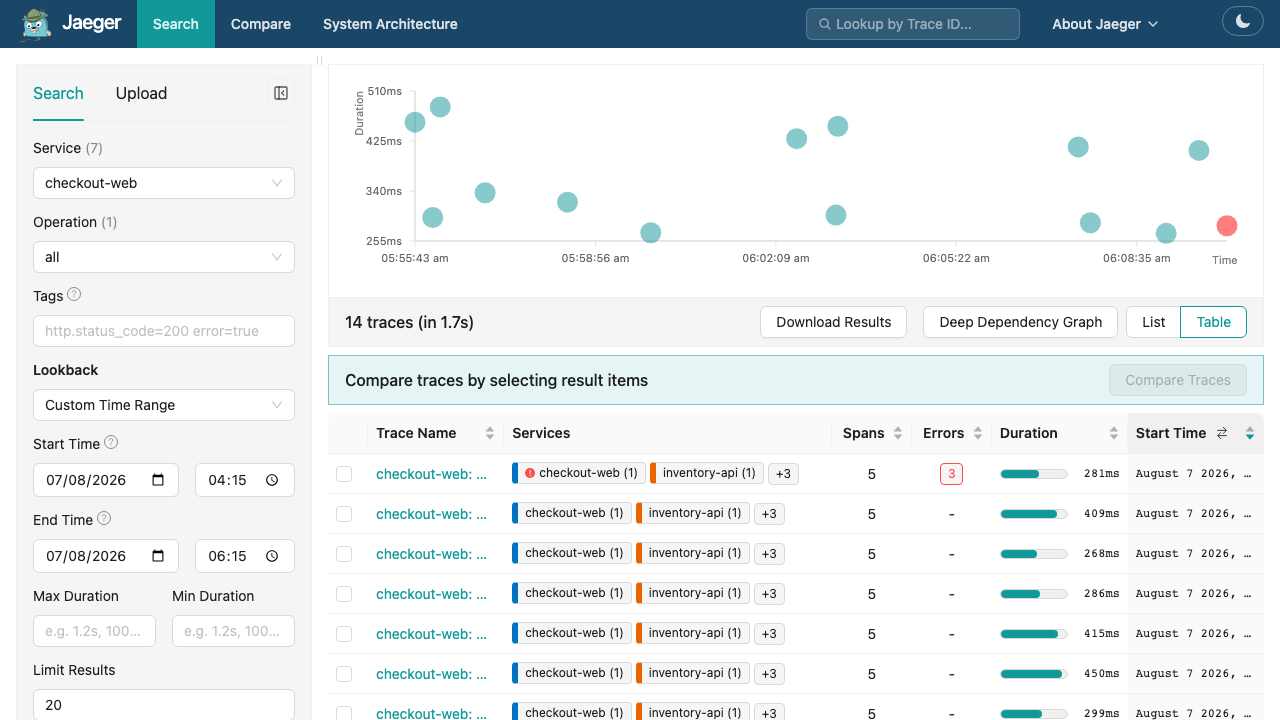
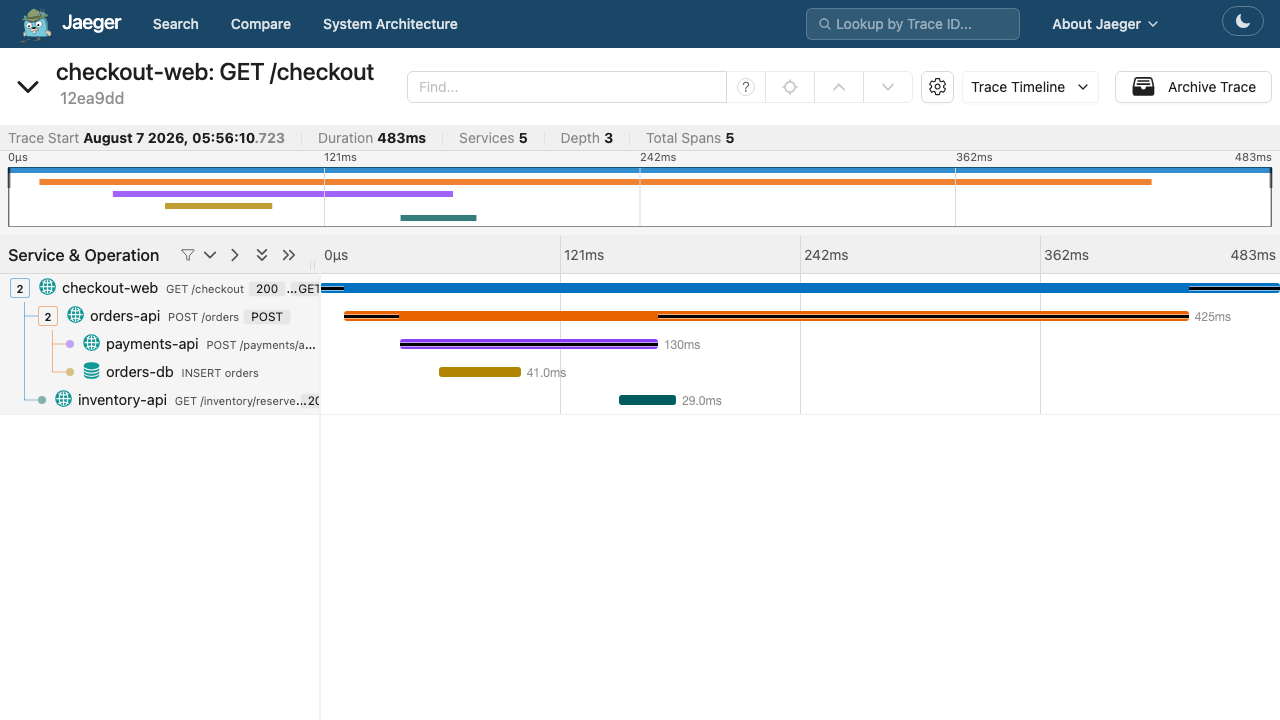
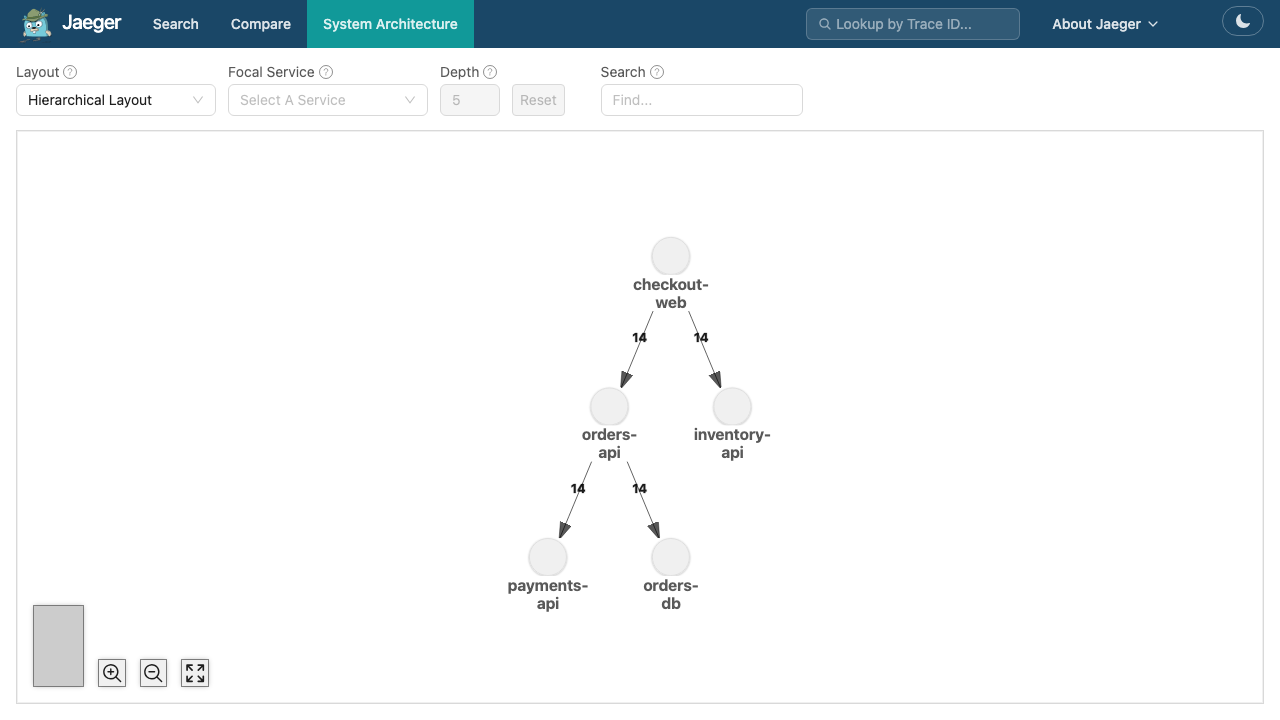
Real screenshots taken while testing this image against its deployment guide.

Apache HertzBeat is an open source, real time monitoring and alerting system from the Apache Software Foundation.

AWStats on Ubuntu 24.04 LTS preconfigured machine image for Microsoft Azure, hardened and verified with 24/7 support by ...

Checkmate (by BlueWave Labs) is an open source uptime, infrastructure and incident monitoring platform.

Gatus on Ubuntu 24.04 preconfigured machine image for Microsoft Azure, hardened and verified with 24/7 support by cloudi...
The cloudimg image ships the free and open source, AGPL-3.0 licensed Gigapipe 5.4.4 release, installed from the project'...

This image runs Glances 4.5.5, an open source cross platform system monitor, on Ubuntu 24.04 LTS.