Base
Hardened build
minimal ports, security patches applied at build time

Percona Monitoring and Management, the open source database and system observability platform that unifies metrics, query analytics and dashboards for MySQL, PostgreSQL and MongoDB in one place.
Percona Monitoring and Management (PMM) is a free, open source observability platform for databases and the systems they run on. It collects detailed metrics and query analytics from MySQL, PostgreSQL, MongoDB and ProxySQL alongside host operating system telemetry, then correlates them into a Grafana based web interface with prebuilt dashboards, alerting, query analytics, backup management and automated advisor checks that surface performance, security and configuration issues.
It suits teams that want a single self hosted pane of glass over their database estate, from a single instance to a large fleet, without sending telemetry to a third party service. The all in one server bundles its metrics store, query analytics store, internal database and dashboard interface together, so a complete monitoring backend is ready the moment it starts.
cloudimg delivers PMM Server fully installed behind an nginx reverse proxy, so a working observability backend answers the moment the instance boots. It runs as the single official upstream server container, pinned by digest and managed by systemd, with its complete stack bundled inside. The image is secure by default: the server binds only to loopback behind nginx, and the upstream admin default is never valid on the network because a unique admin password is generated at random on the first boot of every instance and set before the dashboard is reachable, so no shared or default credential is ever baked in. The base is fully patched with unattended security upgrades enabled, and every deployment is paired with a step by step deploy guide and backed by 24/7 cloudimg support.
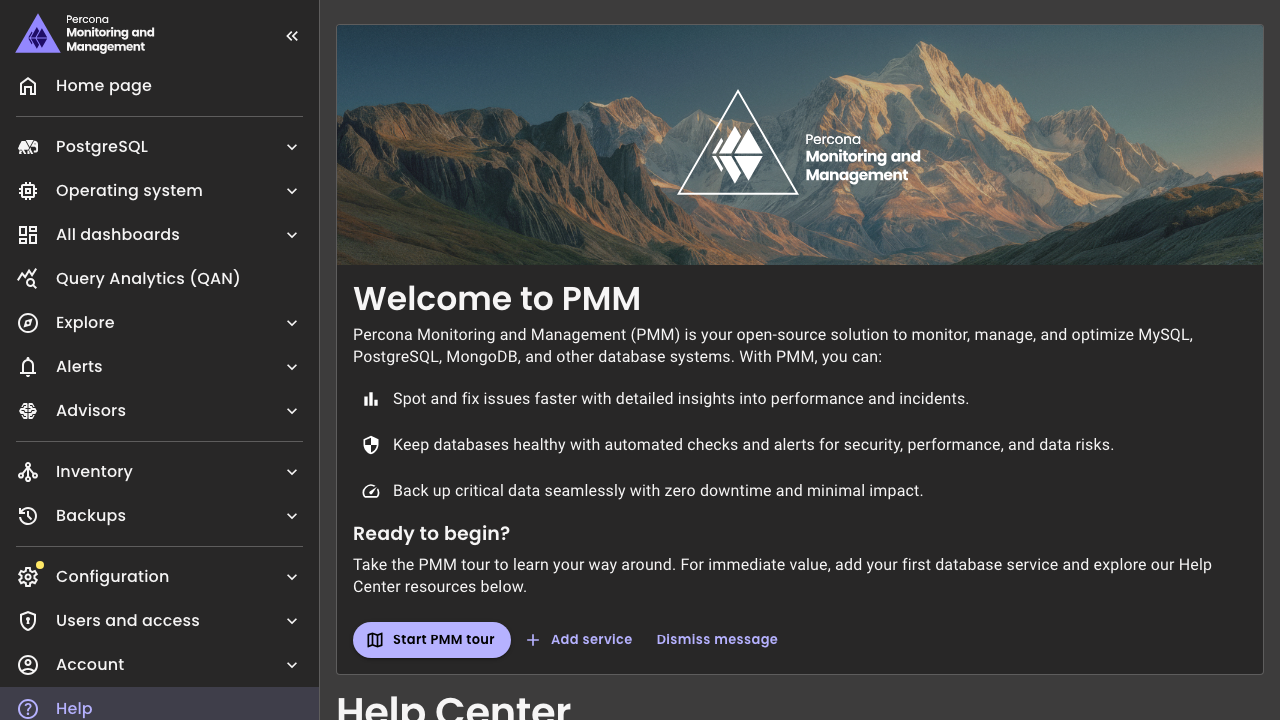
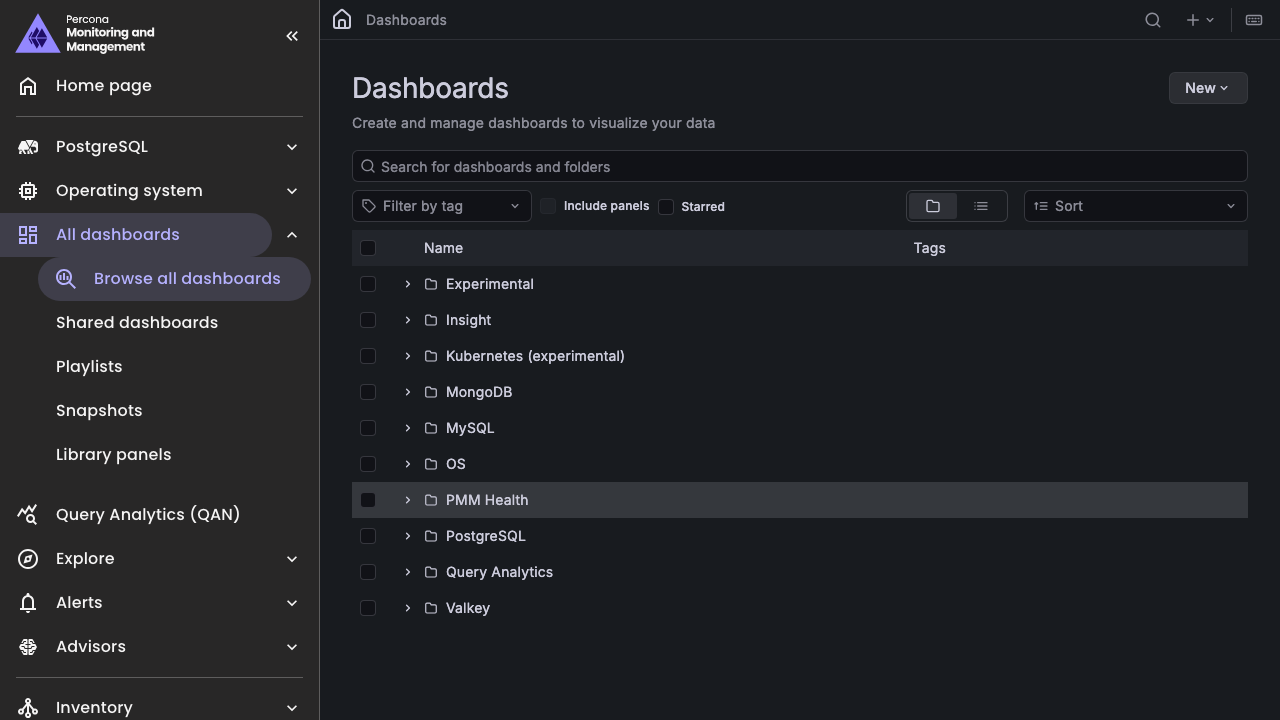
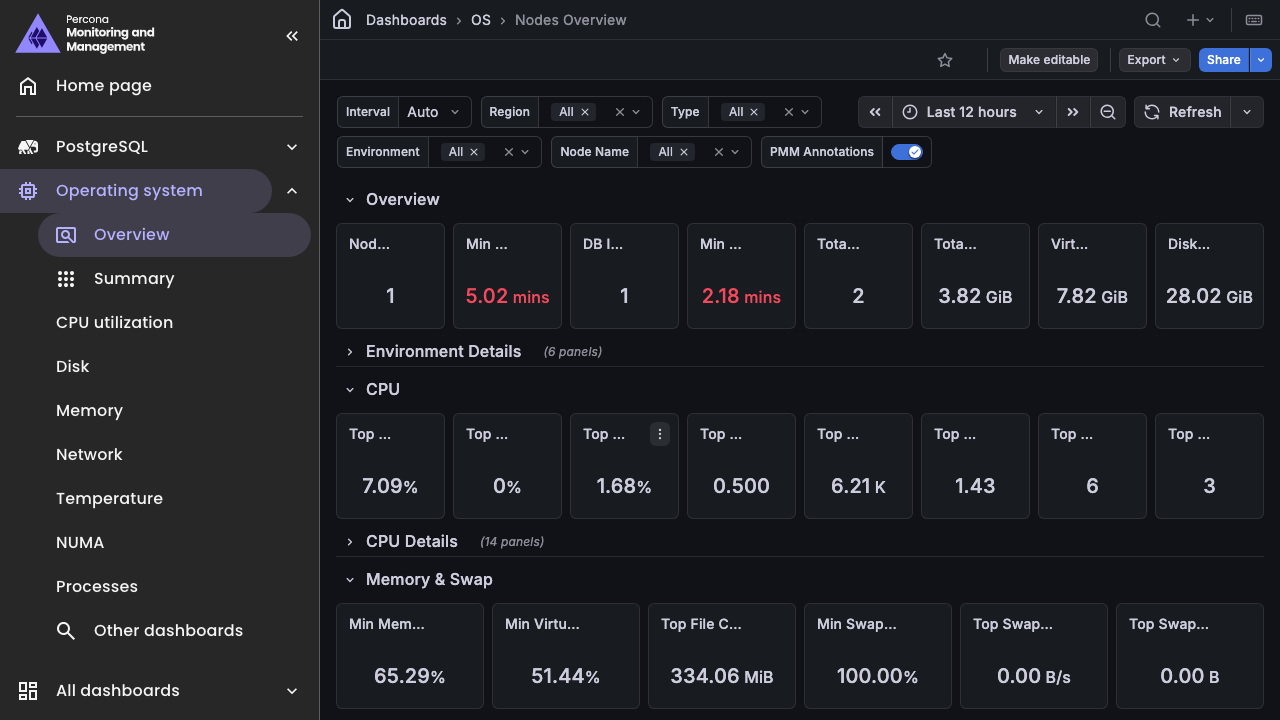
Real screenshots taken while testing this image against its deployment guide.

Apache HertzBeat is an open source, real time monitoring and alerting system from the Apache Software Foundation.

AWStats on Ubuntu 24.04 LTS preconfigured machine image for Microsoft Azure, hardened and verified with 24/7 support by ...

Checkmate (by BlueWave Labs) is an open source uptime, infrastructure and incident monitoring platform.

Gatus on Ubuntu 24.04 preconfigured machine image for Microsoft Azure, hardened and verified with 24/7 support by cloudi...
The cloudimg image ships the free and open source, AGPL-3.0 licensed Gigapipe 5.4.4 release, installed from the project'...

This image runs Glances 4.5.5, an open source cross platform system monitor, on Ubuntu 24.04 LTS.