Base
Hardened build
minimal ports, security patches applied at build time
perfSONAR, the open network measurement toolkit: schedule and run latency, loss, throughput and path tests between hosts, archive the results and explore them on live dashboards.
perfSONAR is the widely deployed open source toolkit for measuring and troubleshooting network performance, developed by ESnet, Internet2, GEANT and Indiana University. It runs active measurements between hosts, one way latency and packet loss with owamp and twamp, throughput with iperf3, round trip time and path traces, and coordinates them through pScheduler so tests are scheduled, de conflicted and run with the right tool. Results flow into a local OpenSearch measurement archive and are presented on Grafana dashboards, while a lookup service registration advertises the host so it can be found and tested against by the wider perfSONAR mesh. Research, education and enterprise network teams use it to find where along a path performance degrades, to prove a network is clean end to end, and to keep a long term record of how links behave.
cloudimg ships the full perfSONAR Toolkit as one assembled appliance, the measurement daemons, pScheduler, the iperf3 and owamp and twamp tools, the OpenSearch results archive and the Grafana dashboard wired together behind a reverse proxy, so a working measurement point answers within minutes of launch rather than a stack to build. There is no shared credential in the image: the public web front door stays closed until first boot completes, and on first boot every instance mints its own Grafana administrator password and its own Toolkit administration password and regenerates every archive credential, all written to a root only file, so no default web login is ever reachable. The measurement archive binds to localhost only. Every deployment is paired with a step by step deploy guide and backed by 24/7 cloudimg support.
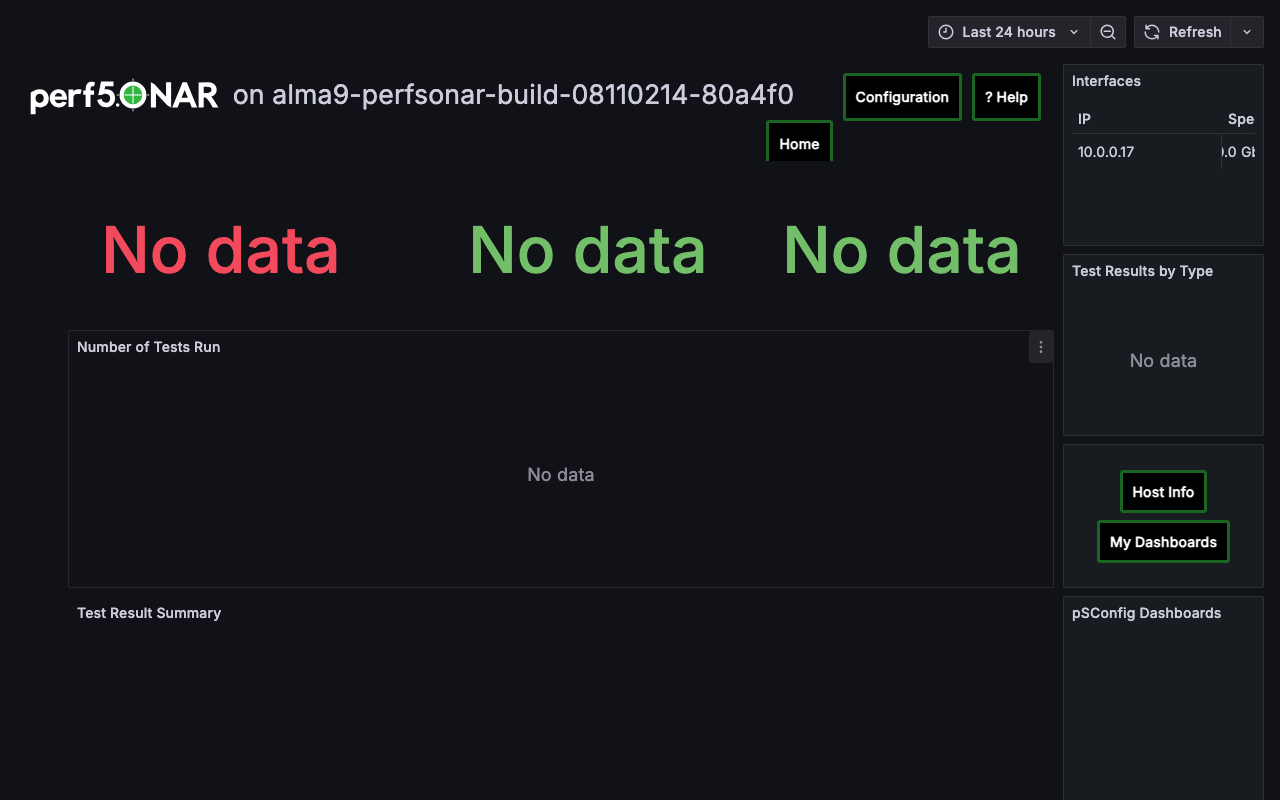
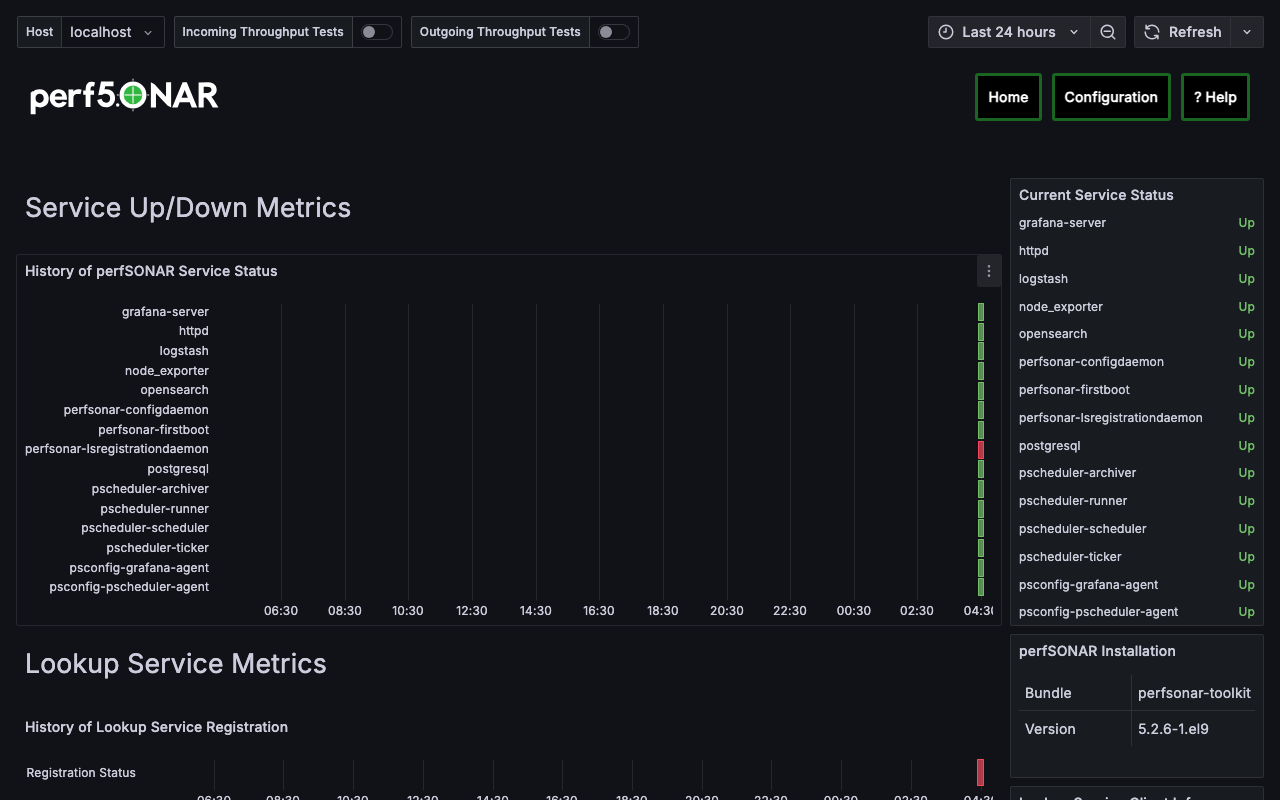
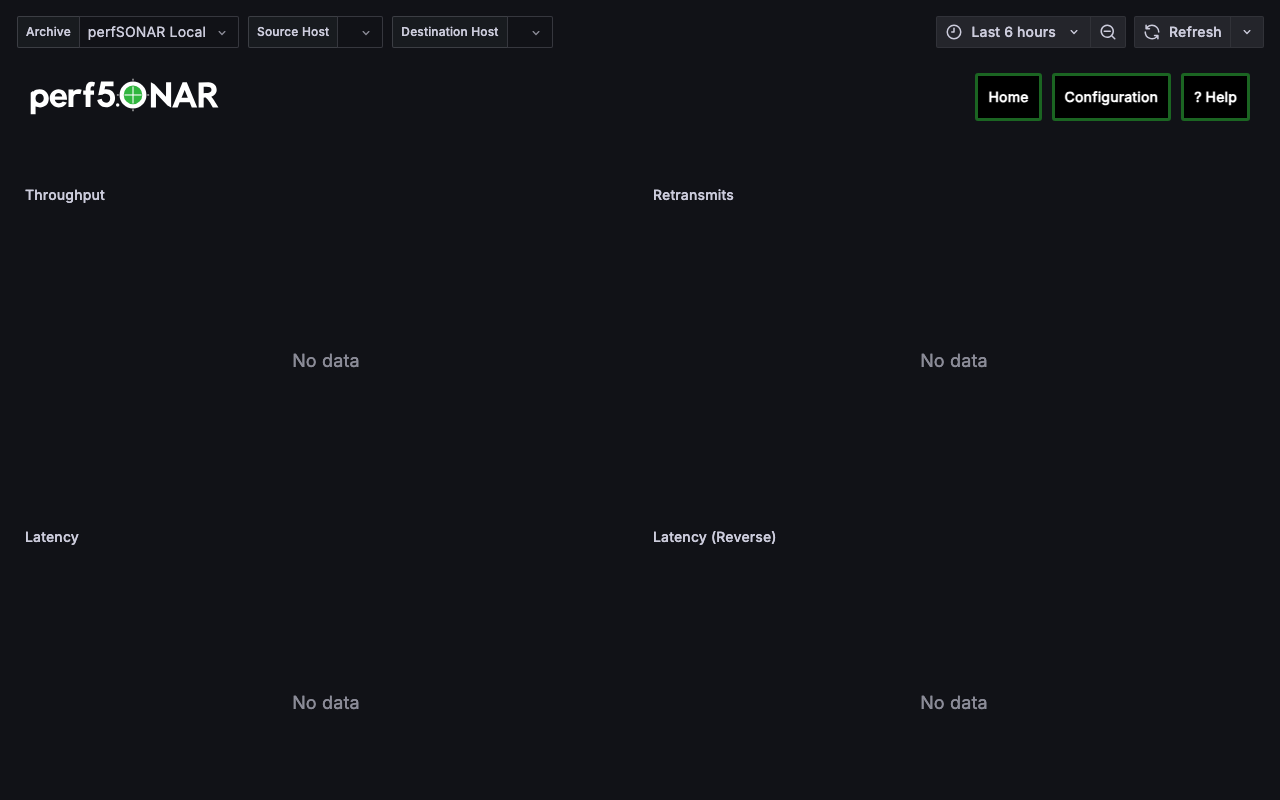
Real screenshots taken while testing this image against its deployment guide.

Apache HertzBeat is an open source, real time monitoring and alerting system from the Apache Software Foundation.

AWStats on Ubuntu 24.04 LTS preconfigured machine image for Microsoft Azure, hardened and verified with 24/7 support by ...

Checkmate (by BlueWave Labs) is an open source uptime, infrastructure and incident monitoring platform.

Gatus on Ubuntu 24.04 preconfigured machine image for Microsoft Azure, hardened and verified with 24/7 support by cloudi...
The cloudimg image ships the free and open source, AGPL-3.0 licensed Gigapipe 5.4.4 release, installed from the project'...

This image runs Glances 4.5.5, an open source cross platform system monitor, on Ubuntu 24.04 LTS.