Base
Hardened build
minimal ports, security patches applied at build time

Perses, the open CNCF dashboards as code observability visualization platform that renders dashboards over your Prometheus, Tempo, Loki and Pyroscope data from a standardized, version controllable spec.
Perses is an open source dashboard and observability visualization platform and a Cloud Native Computing Foundation project. Like Grafana, it renders rich dashboards over your observability data, currently supporting Prometheus metrics, Tempo traces, Loki logs and Pyroscope profiles, bringing the pillars of observability together in one place. What sets Perses apart is its dashboards as code approach: dashboards follow an open, standardized specification and can be authored, validated and version controlled as code using its CLI and SDKs, making it a natural fit for GitOps workflows.
It suits teams that want a lightweight, self hosted, single node dashboard platform for their metrics, traces, logs and profiles, with an open spec and a JSON REST API for automation.
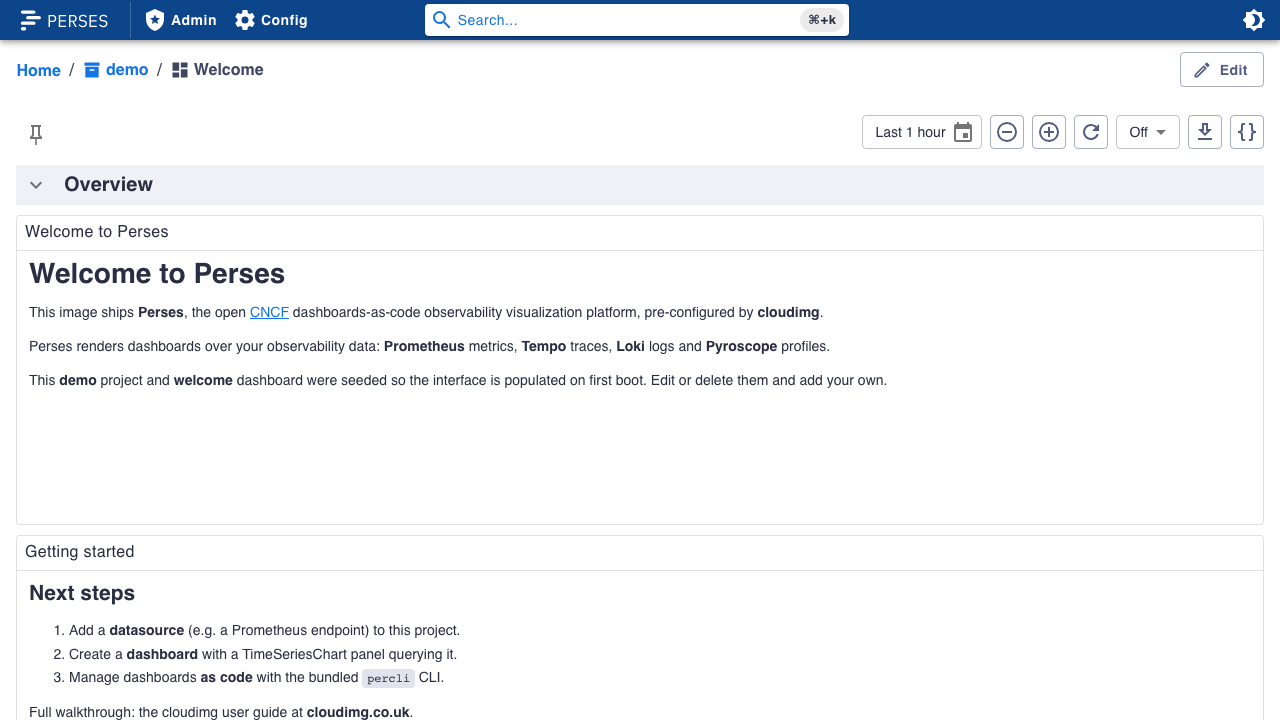
cloudimg delivers Perses fully installed behind an nginx reverse proxy, so a working dashboard platform answers the moment the instance boots. It runs as a single self contained server with its React interface embedded and a file based backend for projects and dashboards, kept lightweight and managed by systemd. The image is secure by default: Perses binds only to loopback and is fronted by nginx behind an HTTP Basic Auth gate whose password is generated uniquely and at random on the first boot of every VM, so no shared or default credential is ever baked in, with a per instance at rest encryption key generated the same way. A demo project and a sample dashboard are seeded so the interface is populated on first boot. The base is fully patched with unattended security upgrades enabled, and every deployment is paired with a step by step deploy guide and backed by 24/7 cloudimg support.
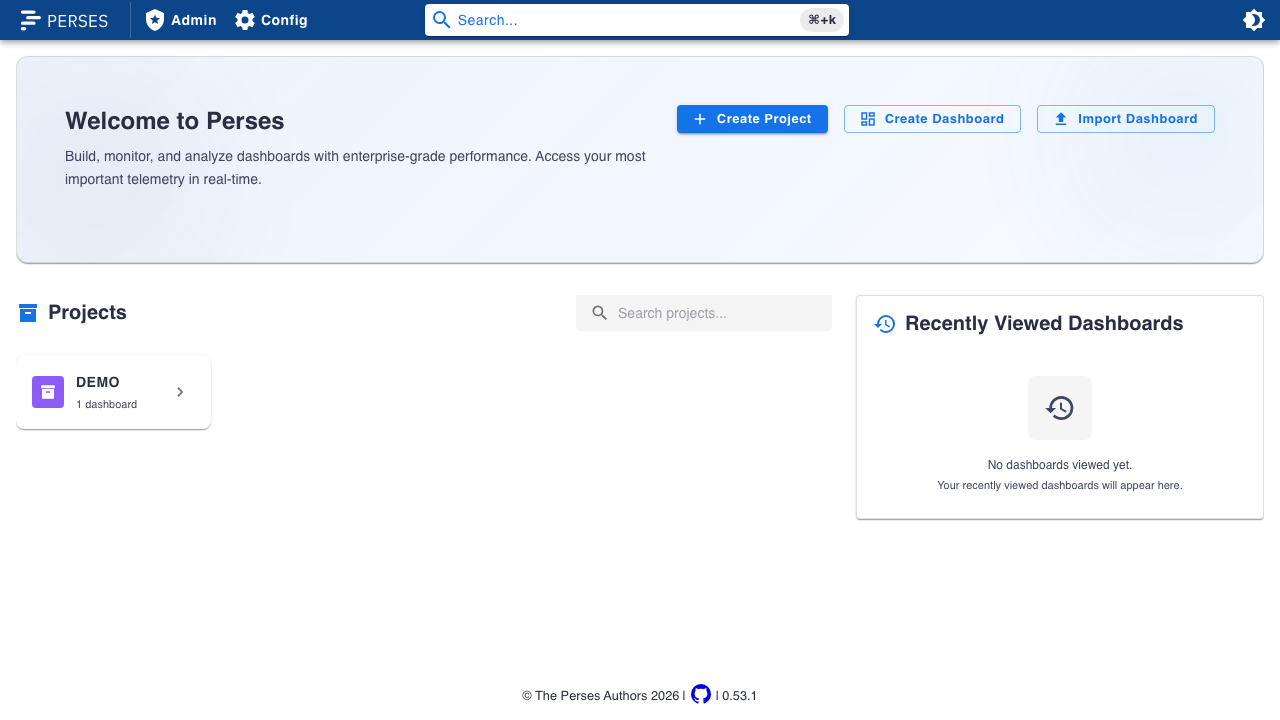
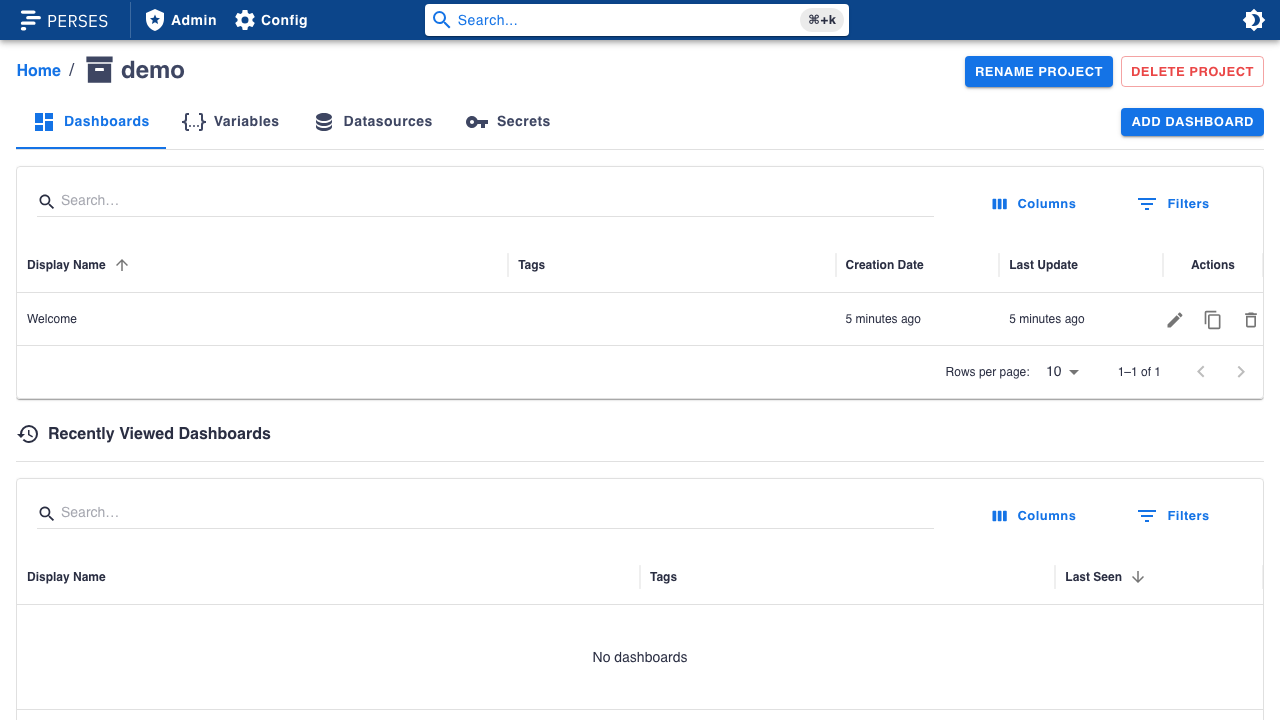
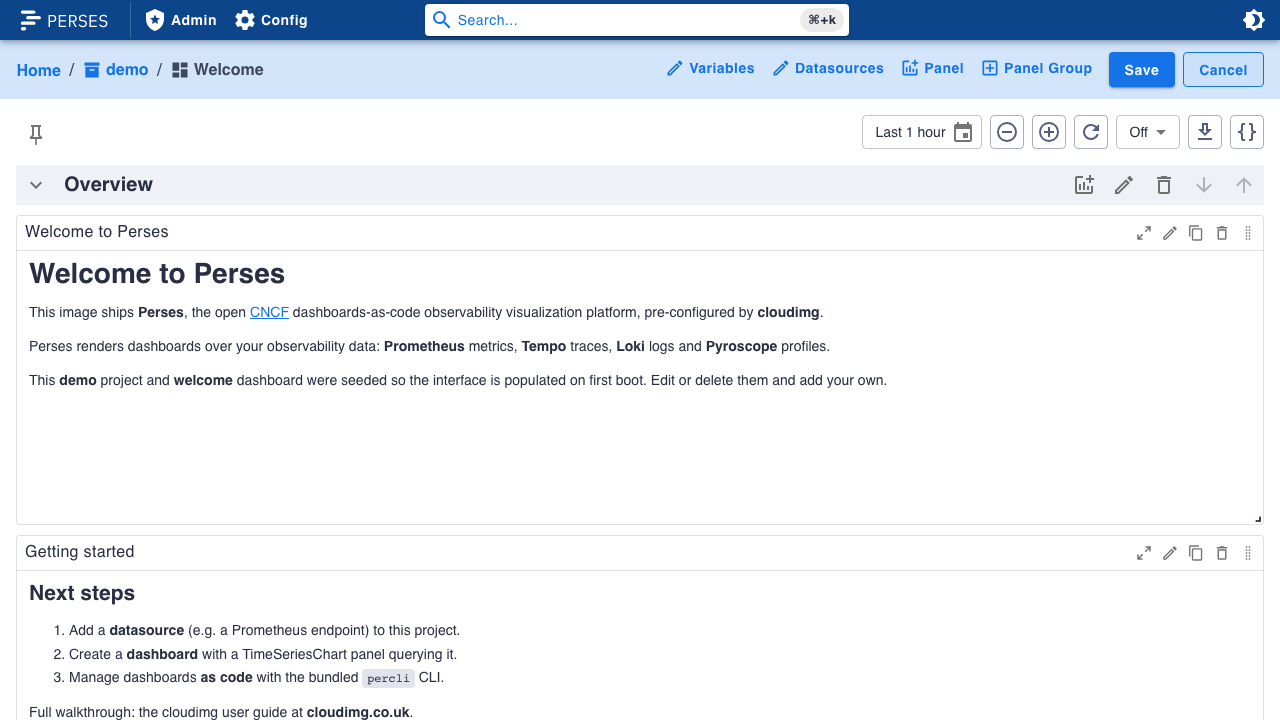
Real screenshots taken while testing this image against its deployment guide.

Apache HertzBeat is an open source, real time monitoring and alerting system from the Apache Software Foundation.
AWStats on Ubuntu 24.04 LTS preconfigured machine image for Microsoft Azure, hardened and verified with 24/7 support by ...

Checkmate (by BlueWave Labs) is an open source uptime, infrastructure and incident monitoring platform.

Gatus on Ubuntu 24.04 preconfigured machine image for Microsoft Azure, hardened and verified with 24/7 support by cloudi...
The cloudimg image ships the free and open source, AGPL-3.0 licensed Gigapipe 5.4.4 release, installed from the project'...
This image runs Glances 4.5.5, an open source cross platform system monitor, on Ubuntu 24.04 LTS.