Base
Hardened build
minimal ports, security patches applied at build time

PostgreSQL monitoring that shows you live database health from the first boot
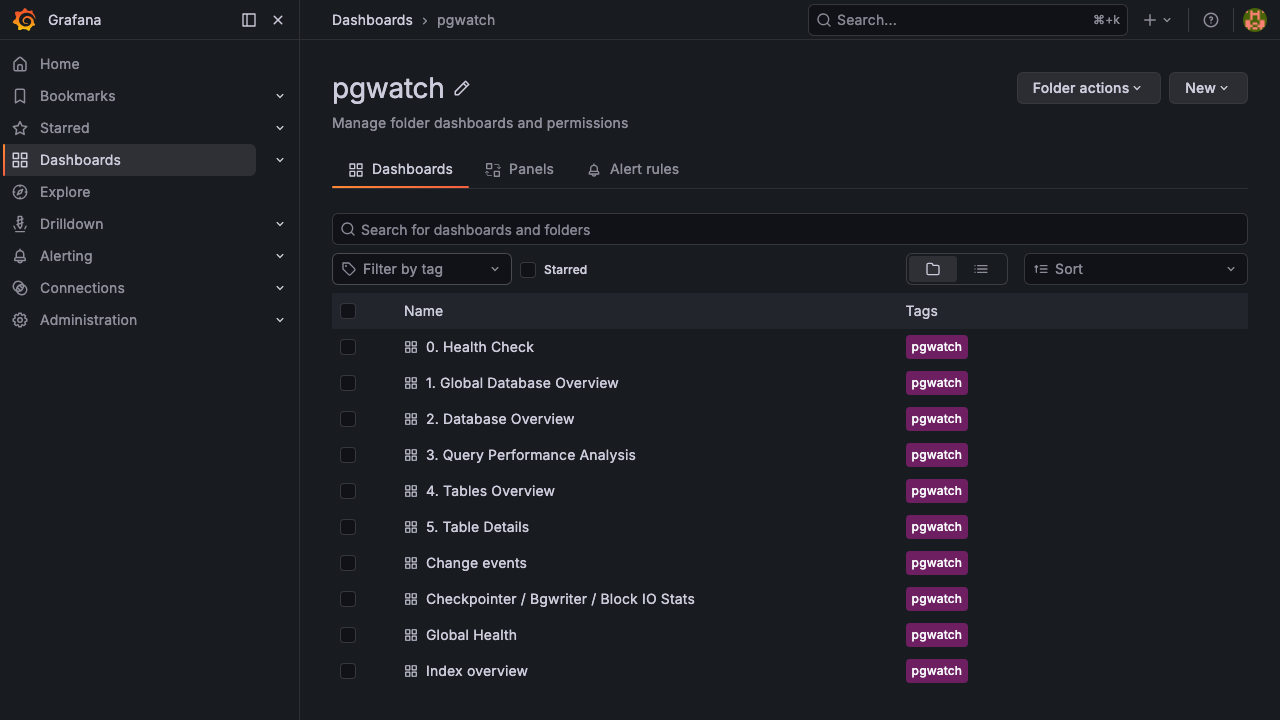
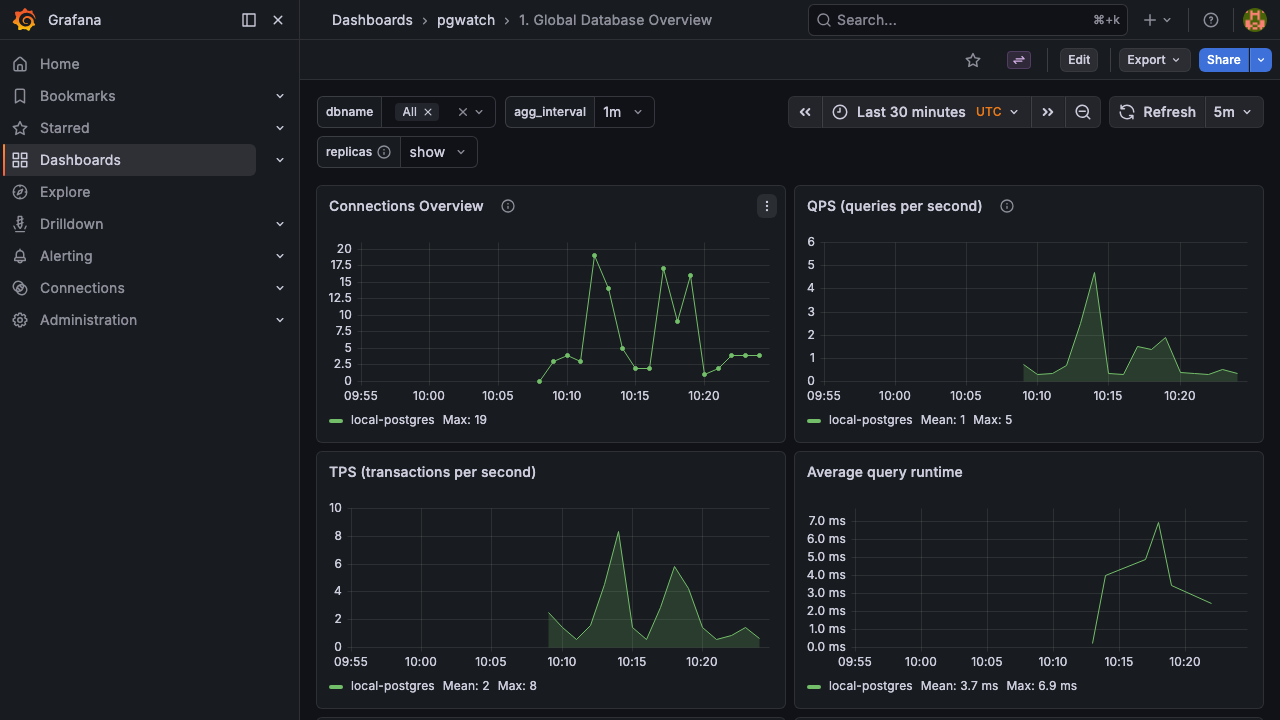
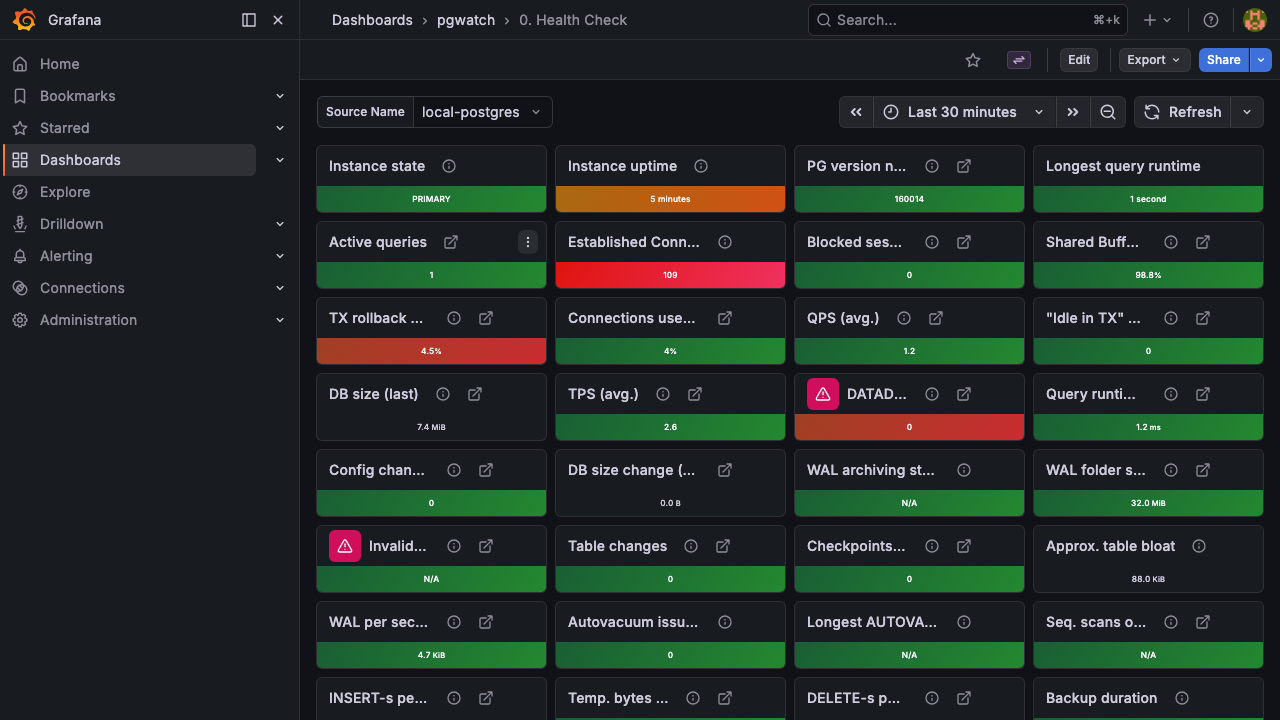
pgwatch is an open source PostgreSQL monitoring stack: a metrics collector, a metrics store and a large library of ready made dashboards. It gathers hundreds of statistics from the databases you point it at, keeps them on a retention schedule, and renders them as charts covering connections, throughput, query performance, table and index behaviour, replication and vacuum activity.
The cloudimg image is a complete appliance rather than a set of parts: the collector, the metrics store and the dashboard UI are installed, wired together and provisioned with the full bundled dashboard library. It also monitors its own bundled database from the first boot, so the dashboards show live data with no configuration at all. Every secret is generated per virtual machine before any service starts, the database and the administrative API are held on loopback, and a paired deployment guide plus 24/7 support come with it.
Real screenshots taken while testing this image against its deployment guide.

Apache HertzBeat is an open source, real time monitoring and alerting system from the Apache Software Foundation.

AWStats on Ubuntu 24.04 LTS preconfigured machine image for Microsoft Azure, hardened and verified with 24/7 support by ...

Checkmate (by BlueWave Labs) is an open source uptime, infrastructure and incident monitoring platform.

Gatus on Ubuntu 24.04 preconfigured machine image for Microsoft Azure, hardened and verified with 24/7 support by cloudi...
The cloudimg image ships the free and open source, AGPL-3.0 licensed Gigapipe 5.4.4 release, installed from the project'...

This image runs Glances 4.5.5, an open source cross platform system monitor, on Ubuntu 24.04 LTS.