
Grafana OSS - Observability and Dashboarding
Overview
Pre-configured Grafana OSS with nginx reverse proxy - launch a full observability platform in under five minutes with no manual setup. Backed by 24/7 cloudimg support.
See it running
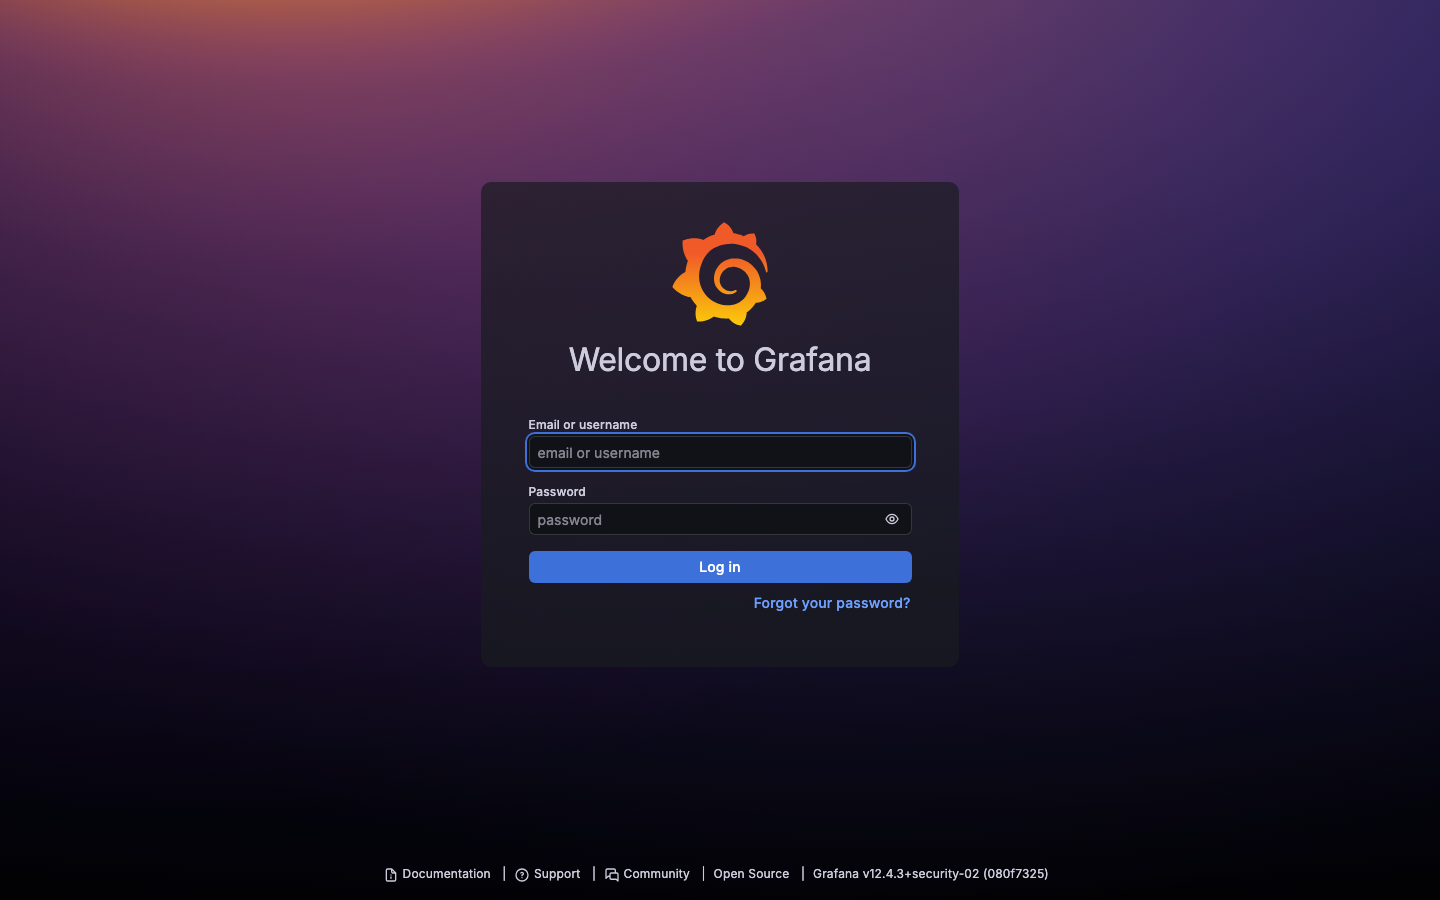
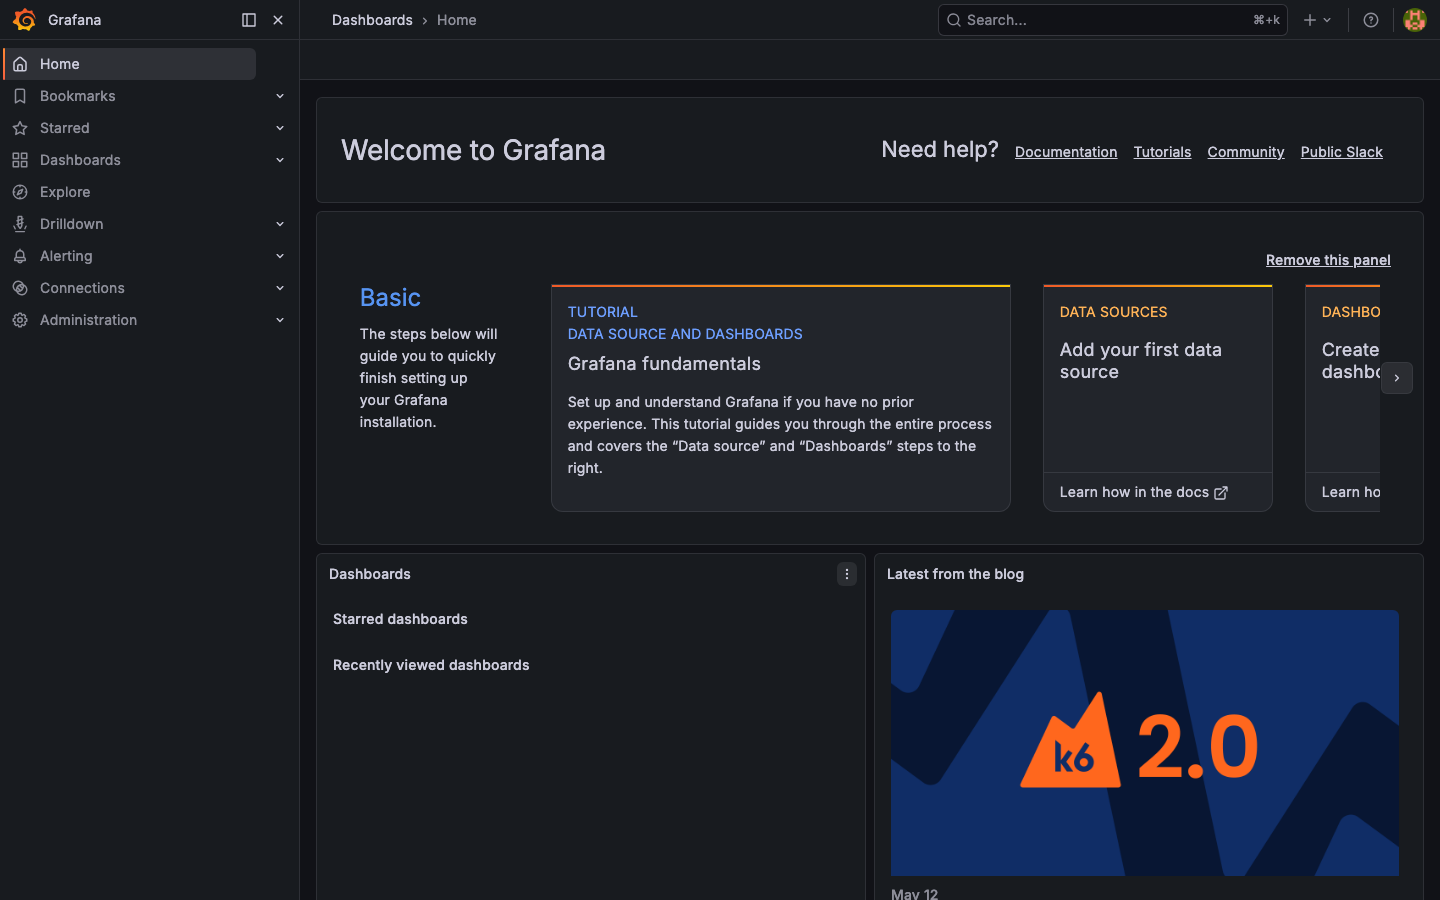
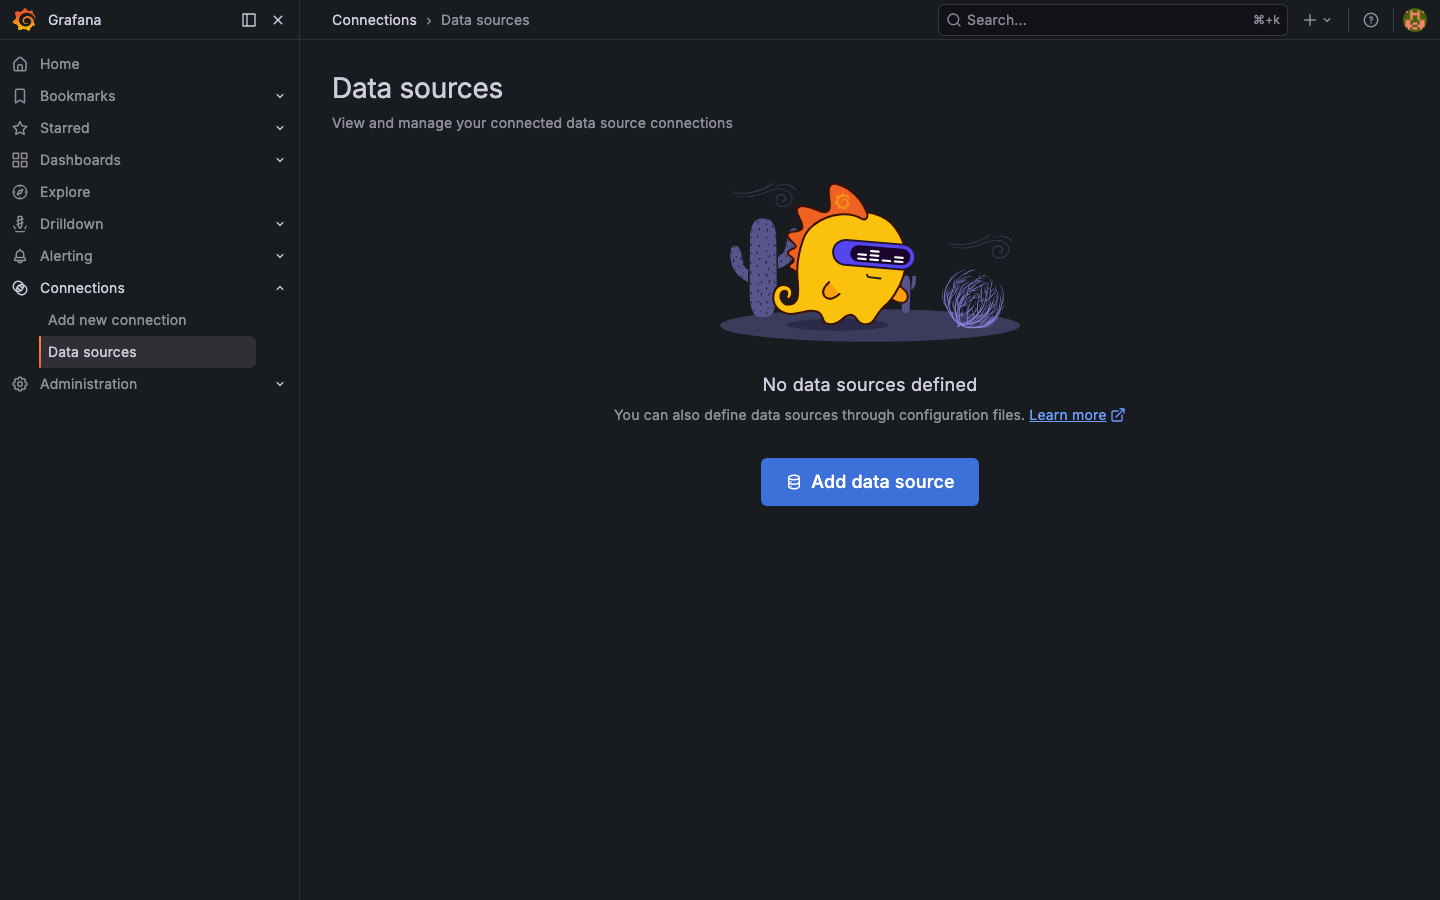
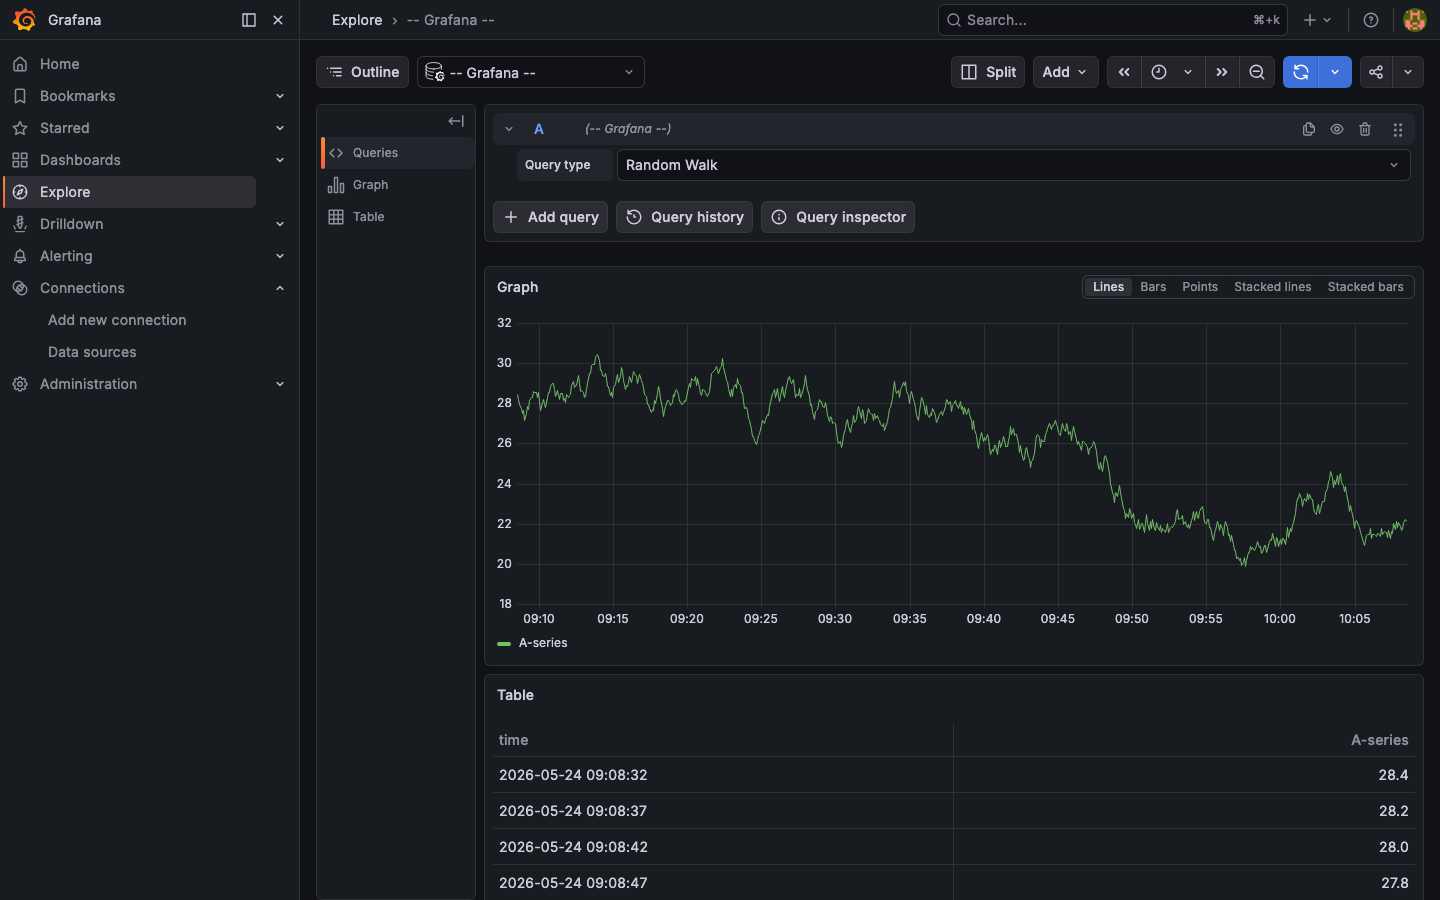
Real screenshots of this software running on the cloudimg image, taken while testing the deployment guide.
Description
This is a repackaged open source software product wherein additional charges apply for cloudimg support services.
## Grafana OSS - Production-Ready Observability by cloudimg
This is a repackaged open source software product wherein additional charges apply for cloudimg support services.
### Why This AMI Over Manual Installation
Deploying Grafana from scratch requires installing dependencies, configuring systemd services, setting up a reverse proxy, hardening credentials, and tuning permissions. This AMI eliminates that entire workflow. Launch an EC2 instance, and within minutes you have a fully operational Grafana platform with nginx already proxying traffic, a unique administrator password generated automatically, and no default credentials to rotate. Compared to other Grafana AMIs, this image ships with a hardened first-boot process that prevents credential reuse across instances - a common security gap in community images.
### Application Stack
- Grafana OSS (latest12.x line) running as a systemd service on a dedicated data volume with bundled SQLite for single-instance deployments
- nginx reverse proxy on port 80 forwarding to Grafana on127.0.0.1:3000 - the upstream is never exposed to the public internet
- Secure first-boot service generates a fresh administrator password unique to each instance, rotates the Grafana admin user via grafana-cli, and stores the credential in a root-only file
### Instance Requirements and Sizing
- Minimum recommended instance: t3.small (2 vCPU, 2 GB RAM) for light workloads with fewer than 10 dashboards and a handful of data sources
- Production workloads: t3.medium or larger for environments with dozens of dashboards, multiple concurrent users, and frequent alerting evaluations
- Storage: 20 GB EBS volume minimum; scale based on data retention needs
- Architecture: x86_64 (AMD64)
- Network: Security group must allow inbound TCP port 80; no additional ports required for standard operation
- Scaling note: SQLite is suitable for single-instance deployments; for high-availability or multi-node setups, consider an external PostgreSQL or MySQL database
### Security Posture
- No shared or default credentials ship in the image
- nginx ensures Grafana listens only on localhost, reducing attack surface
- Administrator password stored with0600 permissions readable only by root
- EBS encryption is supported - enable it at launch for data-at-rest protection
- For data-in-transit encryption (HTTPS/TLS), configure a certificate on nginx or terminate TLS at an Application Load Balancer
### Getting Started Workflow
1. Launch the AMI on your chosen EC2 instance type with port 80 open in your security group
2. SSH into the instance and retrieve the generated admin password from /root/.grafana_admin_password
3. Browse to the instance public IP or DNS to reach the Grafana sign-in page
4. Log in with username "admin" and the retrieved password
5. Add your first data source (Prometheus, CloudWatch, InfluxDB, Loki, Elasticsearch, PostgreSQL, MySQL, or any of dozens of supported connectors)
6. Build dashboards, configure alert rules, and invite team members
### Use Cases
- SRE Golden Signals Monitoring: Connect Prometheus, build dashboards tracking latency, traffic, errors, and saturation across your EC2 fleet, and set alert thresholds that notify your on-call team via Slack or PagerDuty
- Infrastructure and application monitoring for teams running workloads on AWS
- Business intelligence and KPI dashboards pulling from PostgreSQL or MySQL
- Log analytics with Loki or Elasticsearch backends
- IoT and time-series exploration for sensor data and device telemetry
- Multi-cloud cost visibility aggregating billing metrics across providers
### cloudimg Support
24/7 technical support by email and live chat with a one-hour average response time for critical issues. Our engineers provide expert assistance with Grafana deployment, data source configuration, dashboard authoring, alerting rules, plugin management, and version upgrades.
All product and company names are trademarks or registered trademarks of their respective holders. Use of them does not imply any affiliation with or endorsement by them.
Key Features
- Launch a complete Grafana observability platform in minutes with zero manual setup. The AMI ships with Grafana OSS 12.x, nginx reverse proxy on port 80, and a dedicated data volume - eliminating the typical multi-step installation of dependencies, service configuration, and proxy setup. Unlike bare community images, this deployment is production-structured from first boot with the upstream Grafana port never exposed to the public internet.
- Every instance generates a cryptographically unique administrator password on first boot - no shared or default credentials exist in the image. The one-shot service rotates the Grafana admin account via grafana-cli and stores the password in a root-only file (0600 permissions). This eliminates the credential-reuse risk common in AMIs that ship with static default passwords, reducing your attack surface from the moment the instance starts.
- 24/7 technical support from cloudimg engineers with a one-hour average response time for critical issues. Get expert help with Grafana deployment, data source integration (Prometheus, CloudWatch, Loki, Elasticsearch), dashboard authoring, alert configuration, plugin management, and version upgrades - so your team can focus on building observability rather than troubleshooting infrastructure.
Related Technologies
Related Products

Apache Airflow - Workflow Orchestration
This image runs Apache Airflow as a single node deployment. Airflow is installed into a dedicated Python virtual environ...
Apache Archiva Repository Manager
This image runs Apache Archiva, the open source build-artifact repository manager - a central, governed store for the bi...
Appsmith Open-Source Low-Code Platform
This image runs Appsmith Community Edition, the open source low-code platform for building internal tools, admin panels,...
Appwrite
Appwrite is an open source backend as a service platform, a self-hosted Firebase alternative that gives developers a com...
changedetection.io - Website Change Monitor
This image runs changedetection.io, the self-hosted service that monitors web pages for changes and notifies you when so...
CloudBeaver - Web Database Manager
CloudBeaver CE is a web-based database manager - a browser edition of the popular DBeaver desktop tool - that lets you c...