Base
Hardened build
minimal ports, security patches applied at build time

Nezha, a self hosted server and website monitoring dashboard, ready with a unique admin password on first boot.
Nezha is a lightweight, self hosted server and website monitoring dashboard. A single self contained Go binary serves both the browser dashboard and the agent connection channel on one port and keeps all of its state in an embedded SQLite database, so there is no external database to run. From the dashboard you watch real time and historical CPU, memory, disk and network for every server through lightweight agents, run HTTP, TCP and Ping availability checks against your websites and endpoints, configure alerts and notifications, schedule tasks, and open a browser based web terminal. It gives small teams a private, resource efficient alternative to hosted monitoring services and heavyweight metrics stacks, with native username and password admin accounts and no external dependencies to provision.
cloudimg ships Nezha secure by default with no baked login. Upstream Nezha seeds a well known default administrator; this image never ships that. On the first boot of every instance a fresh datastore is seeded on the loopback interface, the administrator password is rotated to a unique random value, and a per instance agent connection secret is generated, all written to a root only file for you to retrieve, so no two deployments share a credential. The dashboard runs as a dedicated unprivileged system user under systemd with automatic restarts, the base is fully patched with unattended security upgrades enabled, and every deployment is paired with a step by step guide and backed by 24/7 cloudimg support.
Real screenshots taken while testing this image against its deployment guide.
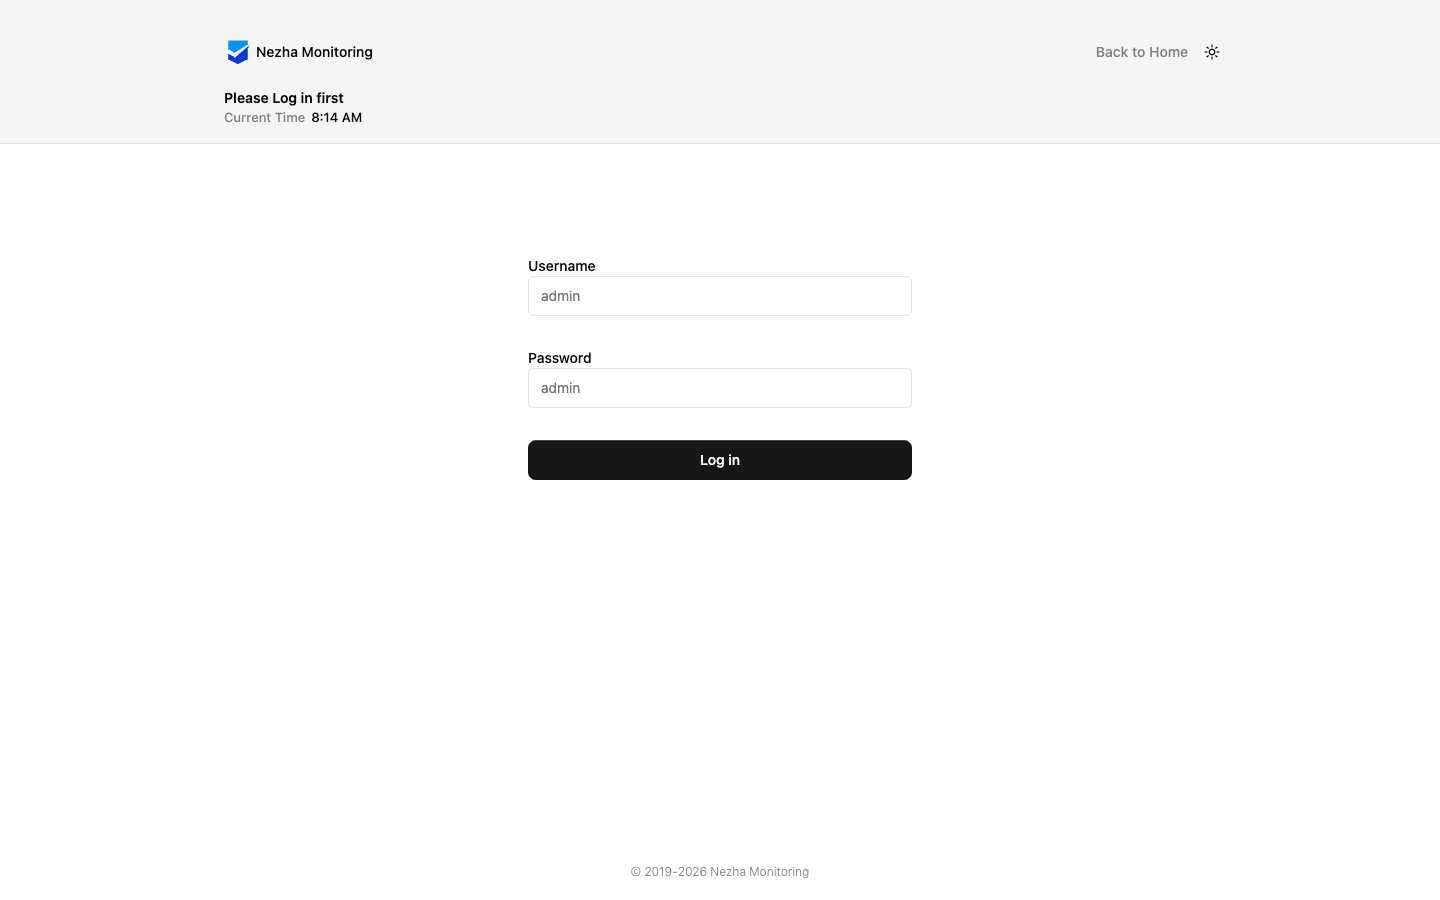
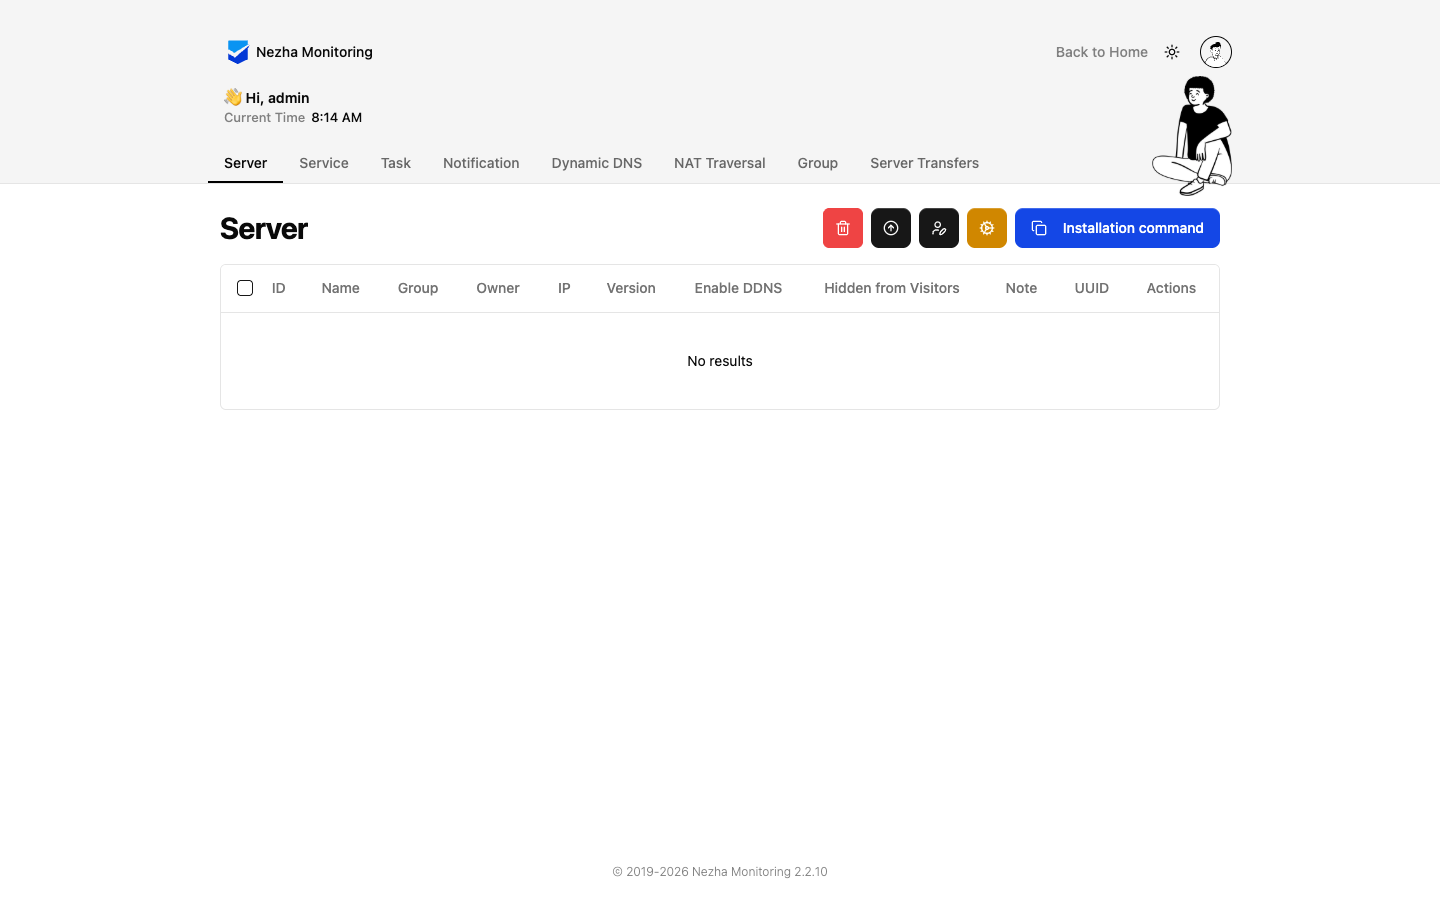
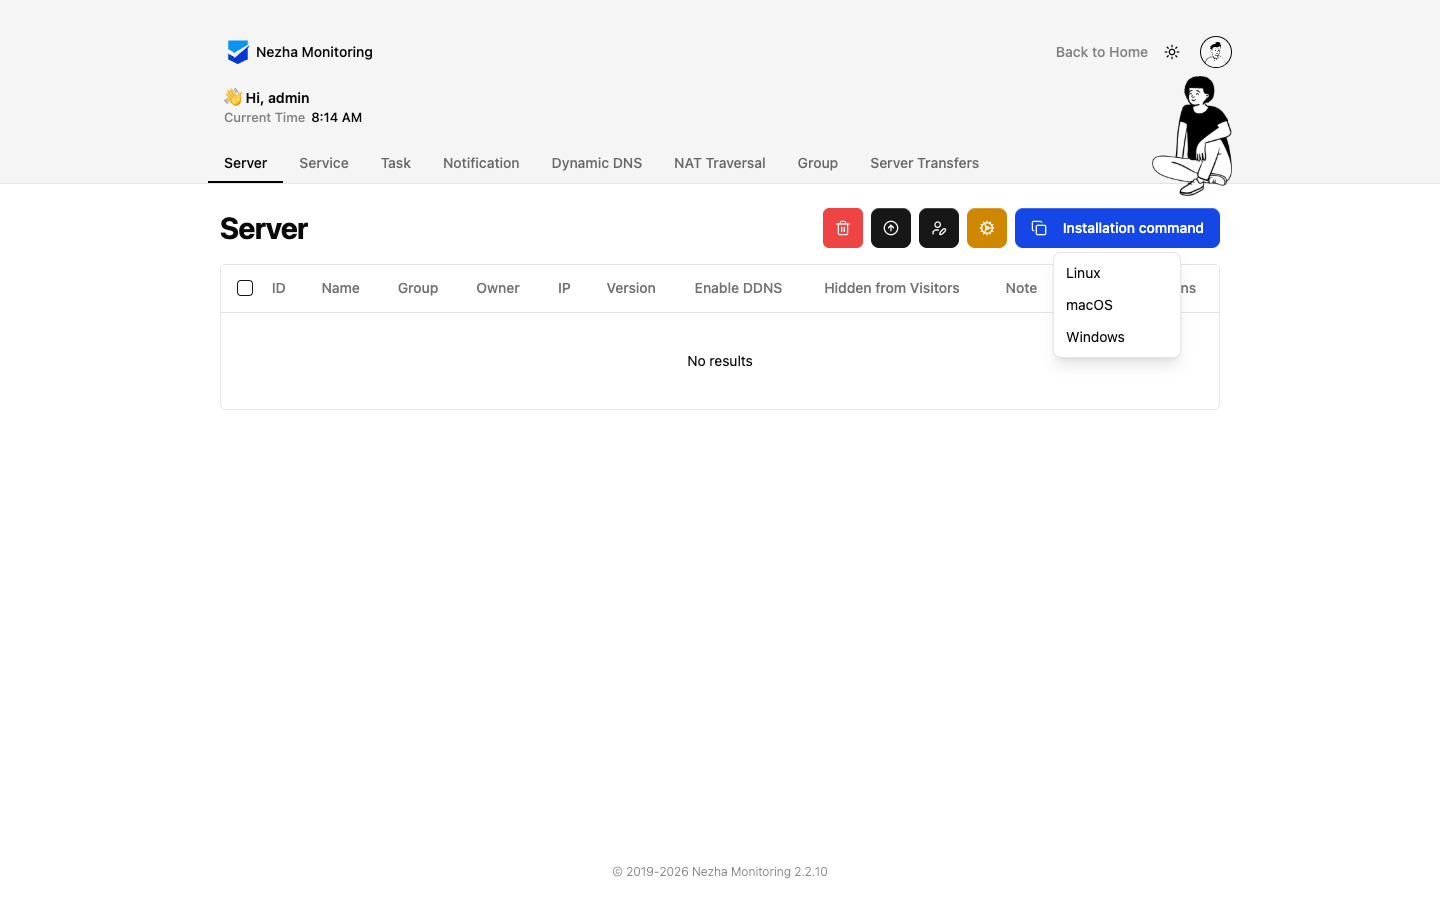
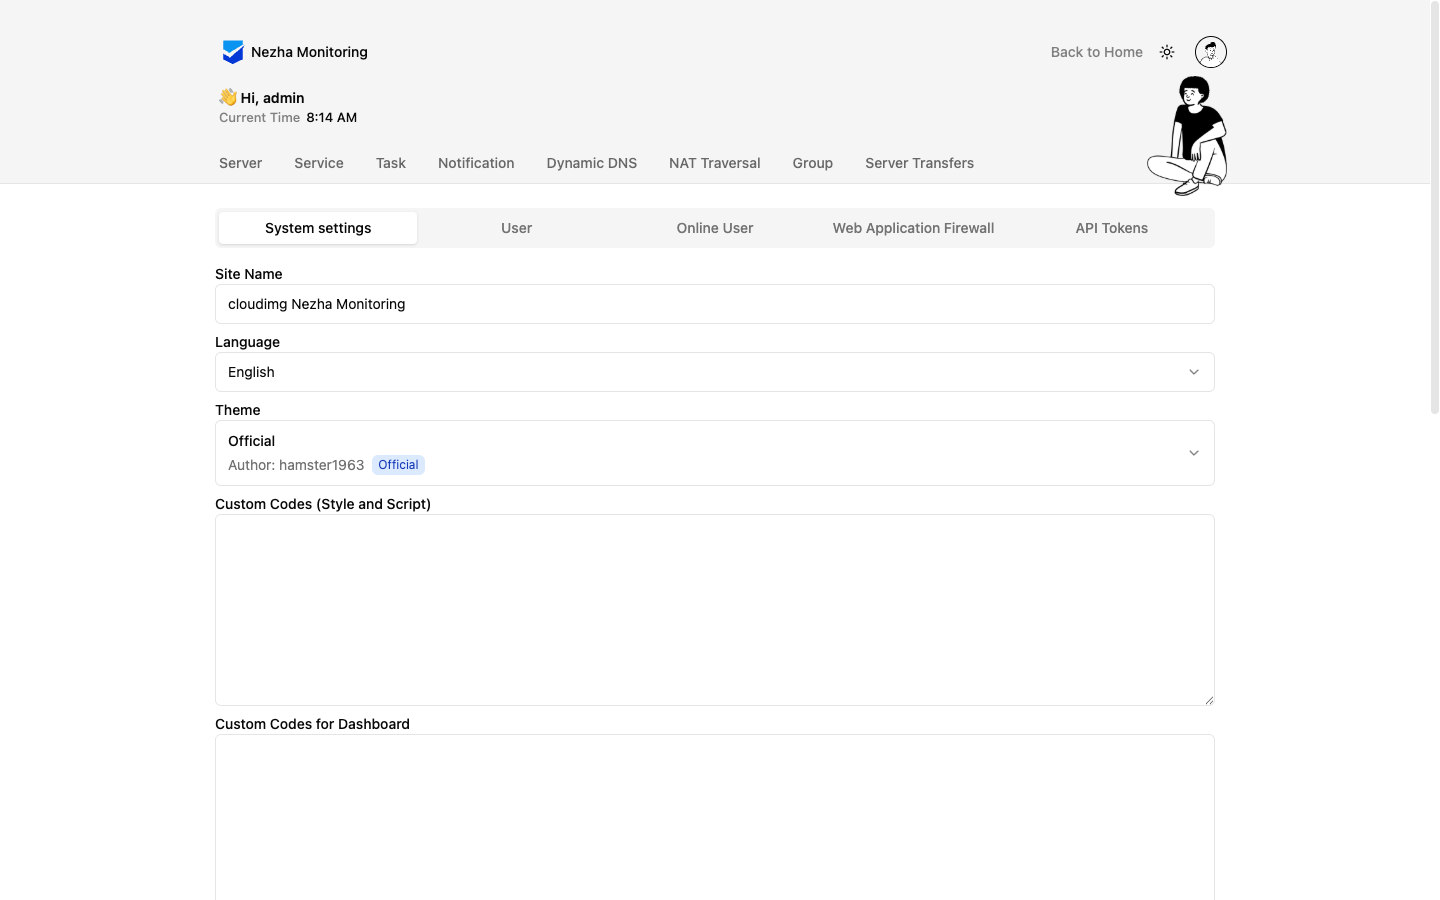
This is a repackaged open source software product wherein additional charges apply for cloudimg support services.
Overview
Nezha is a lightweight, open-source, self-hosted server and website monitoring dashboard that delivers a private monitoring console within minutes of launching your instance. This AMI handles installation, security hardening, and initial configuration so you can focus on watching your infrastructure rather than building the tooling.
Nezha has no per-agent fees regardless of fleet size, and it runs as a single Go binary with embedded SQLite - no external database, message queue, or object store to provision or maintain.
Who Is This For?
Solo developers, small DevOps teams, MSPs, and startups who need a resource-efficient way to watch a fleet of servers and websites without standing up a heavyweight metrics stack. Whether you are monitoring a handful of instances or a mix of servers and public endpoints, Nezha scales from a single host to a multi-system overview with real-time status, historical charts, and alerting.
Application Stack
The Nezha dashboard is a single self-contained Go binary that serves both the web UI and the agent gRPC connection channel on port 8008, storing all state in an embedded SQLite database. It runs as a dedicated, unprivileged system user under systemd. Agents connect to the dashboard to report metrics, and service checks run from the dashboard itself. The current release available is Nezha 2.2.
Secure By Default
This appliance ships with no database and no administrator. On first boot, a one-shot service seeds a fresh datastore bound only to the loopback interface, rotates the administrator to a unique per-instance password, generates a per-instance agent connection secret, and only then exposes the dashboard - proving the weak default login no longer works before opening the port. Zero shared credentials across deployments eliminates the risk of credential reuse. The generated credentials are written to a root-only file.
Key Capabilities
Getting Started
Sign in as the administrator, add your first server with the dashboard's one-line agent installer, create HTTP, TCP, or Ping service checks for your websites, and configure notifications - then watch real-time and historical charts for every monitored system. For pricing details, refer to the Pricing tab on this listing page; the software charge covers ongoing 24/7 cloudimg support services.
Why Choose This Over Self-Deploy?
cloudimg Support
24/7 technical support by email and live chat for deployment, upgrades, integrations, TLS termination, and adding agents and service checks. Our team assists with configuration, performance tuning, and troubleshooting to ensure your monitoring stays healthy.
Nezha is a trademark of its respective owner. All product and company names are trademarks or registered trademarks of their respective holders. Use of them does not imply any affiliation with or endorsement by them.
This image runs CheckCle, the open source self-hosted uptime and infrastructure monitoring platform.

Gatus pre-configured behind an nginx reverse proxy: an automated health and uptime monitoring dashboard and status page ...

Launch a production-ready OpenTelemetry Collector in minutes - pre-secured with per-instance auth, nginx reverse proxy, ...

This image runs Vector, the high-performance, end-to-end open source observability data pipeline by Datadog.

AWStats on Ubuntu 24.04 LTS preconfigured machine image for Microsoft Azure, hardened and verified with 24/7 support by ...

Checkmate (by BlueWave Labs) is an open source uptime, infrastructure and incident monitoring platform.