Base
Hardened build
minimal ports, security patches applied at build time

Grafana Alloy, a vendor neutral OpenTelemetry Collector distribution that collects, processes and forwards your metrics, logs, traces and profiles from one declarative config.
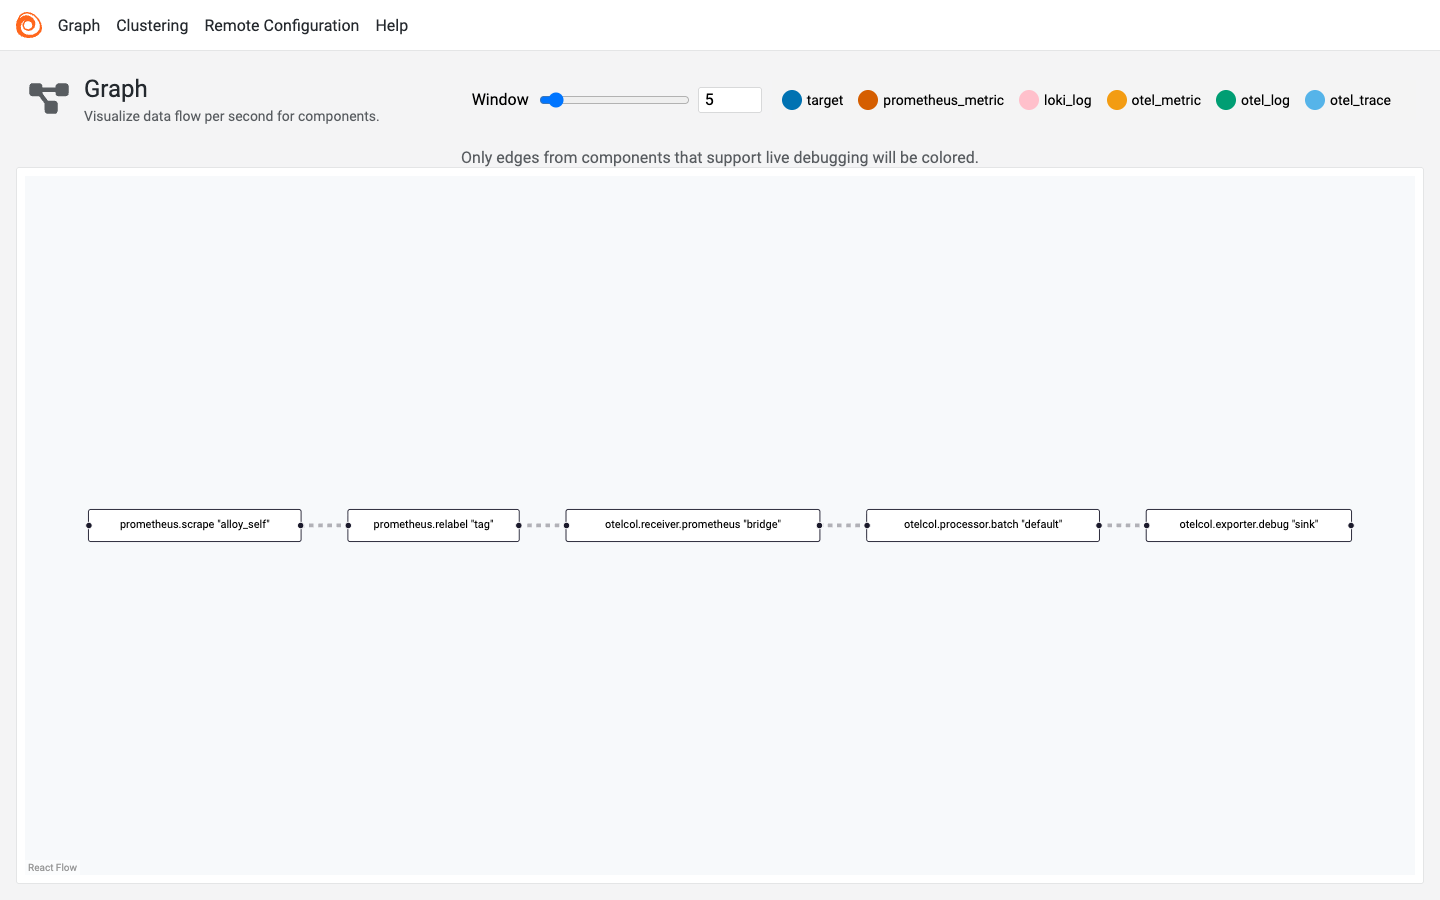
Grafana Alloy is a vendor neutral distribution of the OpenTelemetry Collector. It collects, processes and forwards telemetry, metrics, logs, traces and profiles, using a single declarative configuration built from composable components, and it can ship that data to Prometheus, Grafana Cloud, Mimir, Loki, Tempo, Pyroscope and any OpenTelemetry compatible backend. A built in web UI renders the live component graph and the health of every component, so you can see exactly how telemetry flows through your pipeline.
It suits teams that want a single, flexible agent to gather observability data from their hosts and applications and forward it to the backends they already use, with the whole pipeline defined as code in one file that is easy to version control and reproduce.
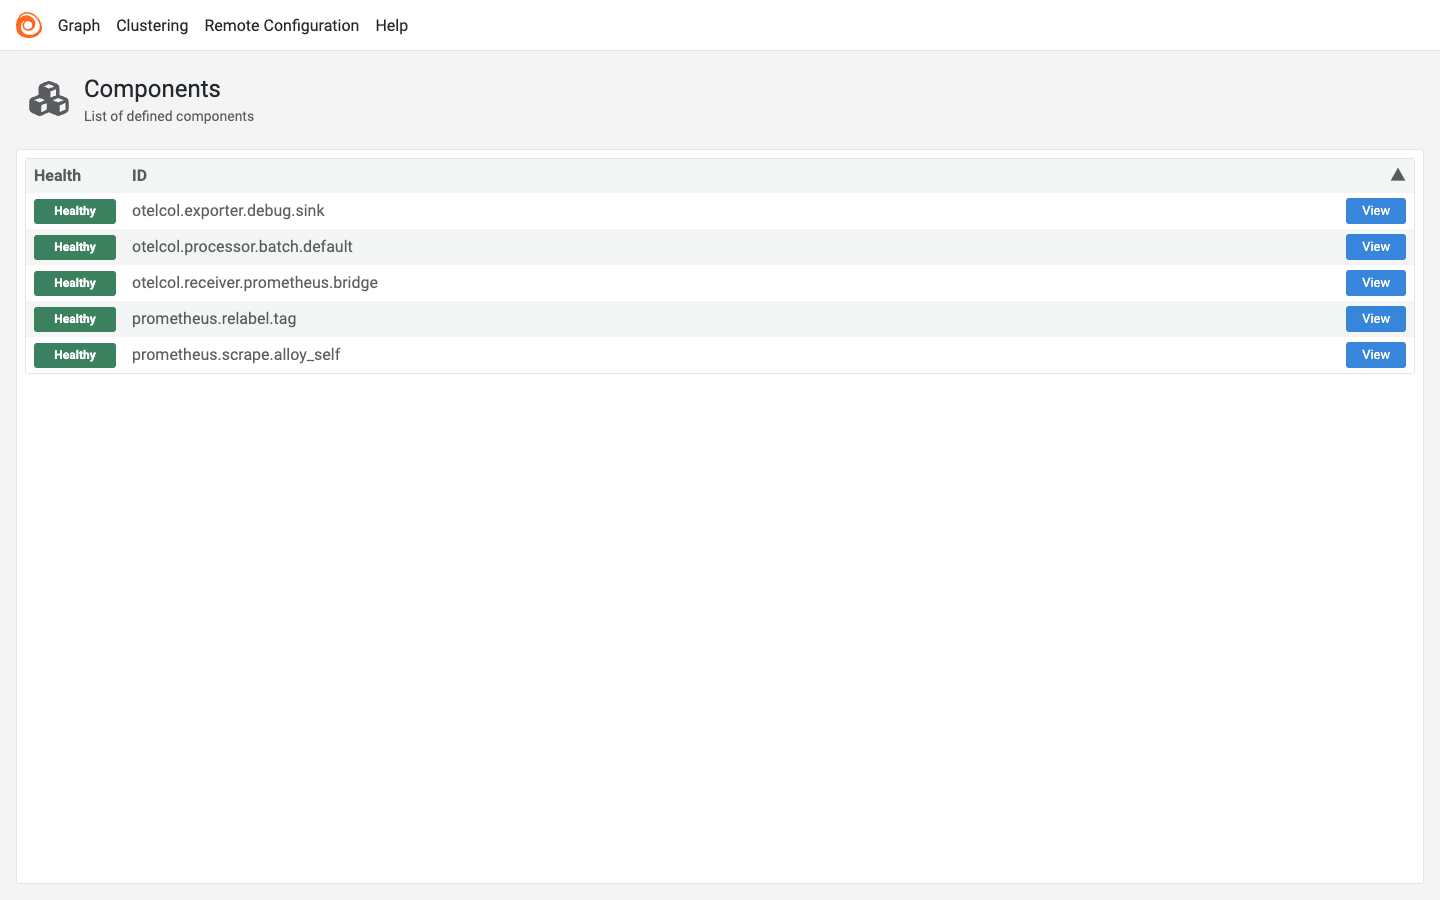
cloudimg delivers Grafana Alloy fully installed from Grafana's official package repository and managed by systemd, so a working collector answers the moment the instance boots. The image is secure by default: because the Alloy web UI has no built in authentication, Alloy is bound to loopback only and fronted by an nginx reverse proxy on port 80 behind an HTTP Basic Auth gate whose password is generated uniquely and at random on the first boot of every VM, so no shared or default credential is ever baked into the image, and an unauthenticated health endpoint is provided for load balancer probes. A fully self contained demo pipeline scrapes Alloy's own metrics, processes and batches them and logs a summary locally, so every component is healthy and the component graph UI is populated on first boot with nothing leaving the VM. The base is fully patched with unattended security upgrades enabled, and every deployment is paired with a step by step deploy guide and backed by 24/7 cloudimg support.
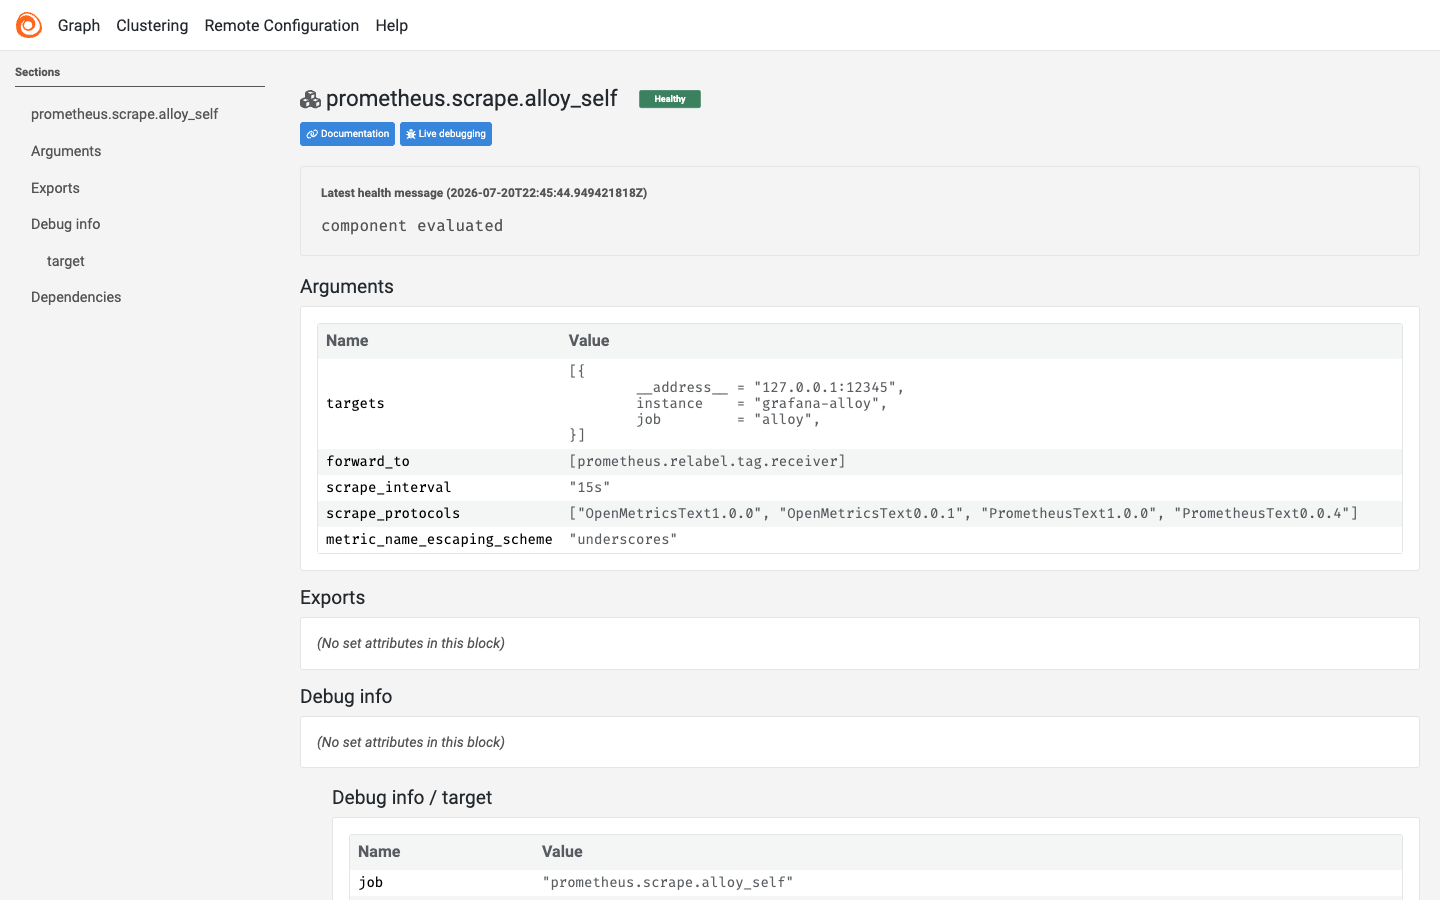
Real screenshots taken while testing this image against its deployment guide.
This is a repackaged open source software product wherein additional charges apply for cloudimg support services.
## Grafana Alloy - Production-Ready OpenTelemetry Collector on AWS
Skip hours of manual setup and launch a fully secured OpenTelemetry Collector in under five minutes. This AMI delivers Grafana Alloy 1.17.1 - the vendor-neutral, single-binary OpenTelemetry Collector distribution from Grafana Labs - pre-installed, hardened, and managed by systemd. It is purpose-built for SREs, platform engineers, and DevOps teams who need to collect, process, and forward metrics, logs, traces, and profiles from a single declarative configuration.
## Why This AMI Instead of a Manual Install
Deploying Alloy from scratch means installing packages, wiring systemd units, configuring a reverse proxy, generating credentials, and hardening the UI endpoint. This image eliminates all of that:
## Working Demo Pipeline Out of the Box
The image ships a self-contained demo pipeline that scrapes Alloy's own internal metrics, tags and batches them, bridges them from the Prometheus pipeline into the OpenTelemetry pipeline, and logs a summary locally. Nothing leaves the instance, every component is healthy on first boot, and the component-graph UI is populated immediately. Explore a real working pipeline, then replace it with your own production configuration.
## Example Production Use Case
A team running dozens of EC2 instances with mixed exporters (Node Exporter, application metrics, structured logs) can deploy this AMI on each host to consolidate collection into a single Alloy process. From one declarative config, Alloy scrapes local Prometheus endpoints, receives OTLP traces from application SDKs, and forwards everything to Grafana Cloud, Mimir, Loki, Tempo, Pyroscope, or any OpenTelemetry-compatible backend - eliminating the need for multiple sidecar agents and reducing operational overhead.
## Ship Telemetry Anywhere
Alloy supports forwarding to:
## Quick Start
1. Launch the AMI with a security group allowing inbound TCP port 80.
2. SSH into the instance and retrieve your unique password from the root-only file.
3. Open http://
4. Explore the live component graph and demo pipeline.
5. Edit the Alloy configuration file to define your production pipeline and restart the service.
## 24/7 Support Included
cloudimg provides around-the-clock technical support covering deployment, upgrades, pipeline configuration, and forwarding telemetry to any supported backend. Support aims to respond within one business day.
---
Grafana and Grafana Alloy are trademarks of Raintank, Inc. dba Grafana Labs. Grafana Alloy is distributed under the Apache License 2.0. All product and company names are trademarks or registered trademarks of their respective holders. Use of them does not imply any affiliation with or endorsement by them.

This image runs CheckCle, the open source self-hosted uptime and infrastructure monitoring platform.

Nezha is an open source, lightweight tool for monitoring your servers and websites: a real time status dashboard, HTTP, ...

This image runs Vector, the high-performance, end-to-end open source observability data pipeline by Datadog.

AWStats on Ubuntu 24.04 LTS preconfigured machine image for Microsoft Azure, hardened and verified with 24/7 support by ...

Checkmate (by BlueWave Labs) is an open source uptime, infrastructure and incident monitoring platform.

Gatus on Ubuntu 24.04 preconfigured machine image for Microsoft Azure, hardened and verified with 24/7 support by cloudi...