OpenTelemetry Collector
Overview
The OpenTelemetry Collector, the vendor-neutral CNCF telemetry pipeline, preinstalled and running as a system service with a working sample pipeline that wires OTLP and host-metrics receivers through a batch processor to file and debug exporters. Point your applications at the OTLP endpoints and route traces, metrics and logs to your observability backend within minutes of launch. Backed by 24/7 cloudimg support.
See it running
Real screenshots of this software running on the cloudimg image, taken while testing the deployment guide.
Description
This is a repackaged open source software product wherein additional charges apply for cloudimg support services.
Overview
The OpenTelemetry Collector is the vendor-neutral, CNCF-graduated way to receive, process and export telemetry. It ingests traces, metrics and logs through pluggable receivers, transforms and batches them through processors, then exports them to dozens of observability backends. This image delivers the feature-rich contrib distribution fully installed and running as a system service with a working sample pipeline, so a telemetry pipeline appliance is processing data within minutes of launch.
Telemetry Pipeline Service
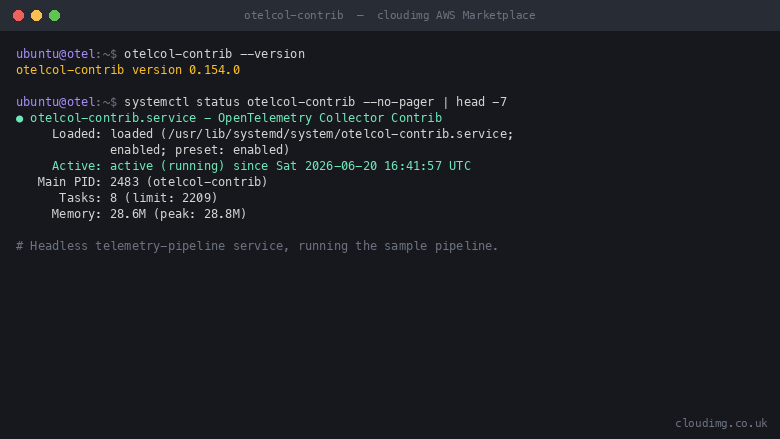
The collector daemon installed from the official release package and run by the bundled systemd service, started on boot and restarted on failure. A self-contained sample pipeline ships ready to run, receiving OTLP and scraping host metrics into a file exporter and the journal, so you can confirm the pipeline is flushing telemetry the moment you log in. Replace the sample receivers and exporters with your own to start collecting and routing your real traces, metrics and logs.
OTLP Receivers Ready
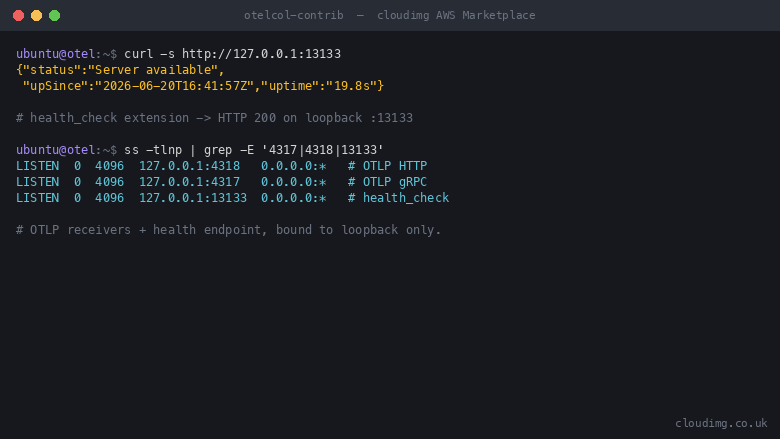
The OpenTelemetry Protocol receivers are configured and listening on the standard gRPC and HTTP ports, bound to loopback by default. Point your instrumented applications and SDKs at the collector, or rebind the receivers to a network interface and open the ports in the security group to accept telemetry from across your fleet. The health-check and zPages extensions are enabled so you can confirm the collector is serving and inspect its live pipeline.
Configurable Pipeline
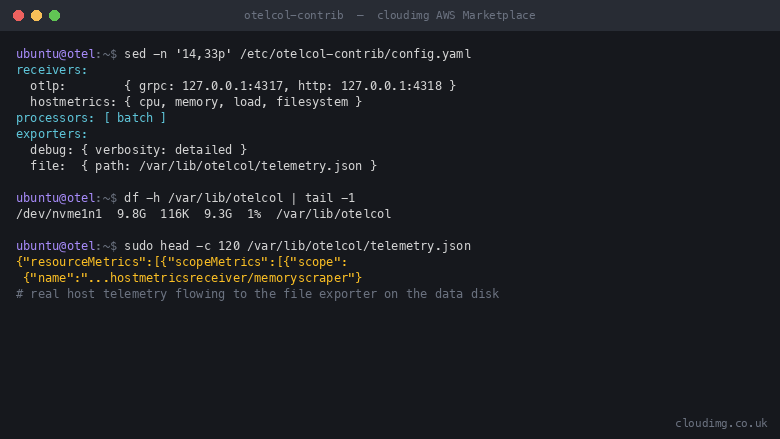
The collector reads its pipeline from a single declarative configuration file. Define receivers to ingest OTLP, Prometheus, host metrics, the journal, syslog and more; chain processors to batch, filter, transform, sample and enrich; and fan out to exporters for your backend: OTLP, Prometheus, Loki, Kafka, file and many others through the contrib distribution. A dedicated data disk holds the exported telemetry off the operating system disk.
Ready To Use
Connect over SSH and the pipeline is already running. Read the welcome notes, edit the configuration file, point your receivers at your sources and your exporters at your destinations, then reload the service. The file exporter output lives on a dedicated, independently resizable data disk.
cloudimg Support
24/7 technical support by email and chat. Help with pipeline design, receiver and exporter configuration, processors and sampling, OTLP and Prometheus ingest, routing to your observability backend, scaling the collector and upgrade planning.
Use Cases
A telemetry gateway aggregating traces, metrics and logs from your fleet before they leave your network. A sidecar or node agent receiving OTLP from instrumented applications. A protocol translator converting between OTLP, Prometheus and your backend's native format. A vendor-neutral collection layer that decouples your instrumentation from your observability backend.
All product and company names are trademarks or registered trademarks of their respective holders. Use of them does not imply any affiliation with or endorsement by them.
Key Features
- The OpenTelemetry Collector contrib distribution, the vendor-neutral CNCF telemetry pipeline, preinstalled and running as a systemd service with a working sample pipeline, no manual setup required
- OTLP gRPC and HTTP receivers plus a host-metrics receiver are wired through a batch processor to file and debug exporters, with the health-check and zPages extensions enabled and a dedicated, independently resizable data disk holding the exported telemetry
- Edit a single declarative configuration file to receive, process and route traces, metrics and logs to your observability backend, with 24/7 technical support from cloudimg