
Prometheus Monitoring - Pre-Configured
Overview
Pre-configured Prometheus with dedicated TSDB storage and 24/7 cloudimg support. Launch production-ready monitoring and alerting in minutes with no manual setup.
See it running
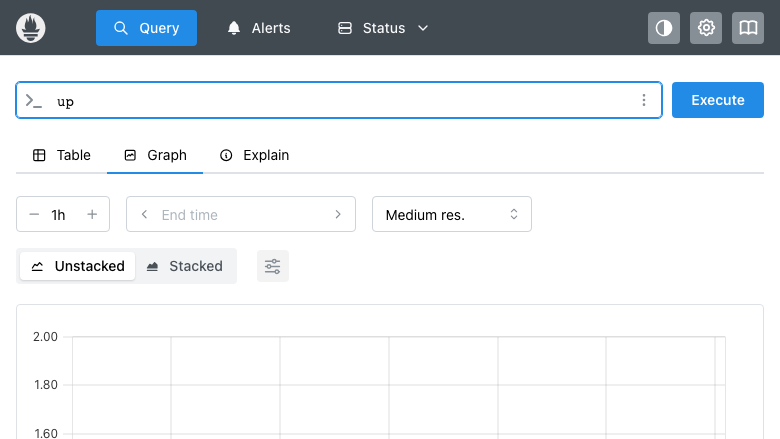
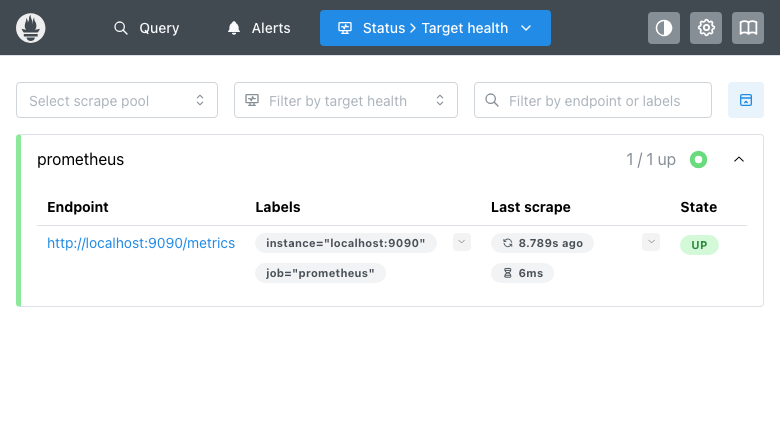
Real screenshots of this software running on the cloudimg image, taken while testing the deployment guide.
Description
This is a repackaged open source software product wherein additional charges apply for cloudimg support services.
## Production-Ready Prometheus Monitoring on AWS
Launch a fully operational Prometheus monitoring and alerting system with no manual installation. This AMI delivers the official Prometheus binary, a dedicated EBS data volume, and a systemd-managed service - all configured and running at first boot. Start collecting metrics and writing alerting rules within minutes of launch.
## Why Choose This AMI
This is a repackaged open source software product with additional charges for cloudimg support services. Unlike a bare Prometheus install, this AMI eliminates the operational overhead of binary installation, storage configuration, and service management. The dedicated EBS volume architecture means your time series data persists independently of the compute instance, surviving instance stops, restarts, and replacements - a critical advantage over ephemeral or root-volume storage approaches that risk data loss.
## Monitoring Stack Details
- Prometheus Service: Running as a systemd unit, installed from the official prometheus.io binary tarball. Automatic start on boot with restart-on-failure behavior.
- Default Configuration: Ships with a scrape configuration that monitors Prometheus itself, providing immediate visibility into system health.
- Expression Browser: The built-in Prometheus web UI and PromQL query engine are available on port 9090 immediately after launch.
- Alerting Engine: The native alerting engine is ready for rule configuration. Connect to Alertmanager for routing alerts to PagerDuty, Slack, email, or custom webhooks.
- Extensible Scrape Targets: Add EC2 instances, Kubernetes endpoints, application exporters, and custom targets by editing the prometheus.yml configuration file.
## Production-Ready Storage Architecture
- Prometheus TSDB data is stored on a dedicated, independently resizable EBS volume separate from the root filesystem.
- The data directory is mounted at boot via filesystem UUID in fstab, ensuring stable mount behavior across instance reboots and AMI launches.
- Storage retention and compaction are controlled via Prometheus command-line flags, allowing you to tune data lifecycle to your requirements.
- Because the data volume is independent, you can resize storage without replacing the instance or risking data corruption.
## Security Considerations
Buyers should note that the Prometheus web UI on port 9090 does not include built-in authentication. We recommend restricting access via AWS Security Groups, placing Prometheus behind a reverse proxy with authentication, or using AWS PrivateLink for internal-only access. Configure your VPC security groups to limit inbound traffic on port 9090 to trusted CIDR ranges only.
## Requirements and Limitations
Buyers should ensure their deployment meets these baseline requirements:
- Ports: Security group must allow inbound TCP on port 9090 for the Prometheus UI and API.
- Storage: The dedicated EBS data volume is provisioned at launch. Resize as needed based on retention period and scrape target count.
- Scaling: Performance depends on the number of active time series and scrape interval. Monitor Prometheus self-metrics for resource saturation.
## Use Cases
- Infrastructure Monitoring: Collect CPU, memory, disk, and network metrics from EC2 fleets using node-exporter, with threshold-based alerts routed through Alertmanager to your on-call system.
- Kubernetes Observability: Monitor EKS or self-managed Kubernetes clusters using kube-state-metrics and node-exporter for pod, node, and cluster-level visibility.
- Grafana Dashboard Backend: Use this Prometheus instance as the data source for Grafana dashboards, enabling team-wide visibility into application and infrastructure health.
- Custom Alerting Pipelines: Build multi-condition alerting rules with PromQL expressions and route notifications through Alertmanager to Slack, PagerDuty, or email.
- Cloud Resource Monitoring: Track AWS resource utilization across multiple accounts by scraping CloudWatch exporter metrics into Prometheus.
## cloudimg Support
24/7 technical support by email and live chat. Our engineers assist with Prometheus deployment, PromQL query optimization, alerting rule design, retention tuning, Grafana integration, and troubleshooting. Critical issues receive a one-hour average response time.
To get started, launch the AMI, browse to port 9090, and begin building your monitoring stack. For guided onboarding assistance, contact cloudimg support.
All product and company names are trademarks or registered trademarks of their respective holders. Use of them does not imply any affiliation with or endorsement by them.
Key Features
- Prometheus launches fully operational at first boot - the official binary runs as a systemd service with automatic restart, the expression browser is live on port 9090, and default self-monitoring scrape is active. No SSH session, no package installation, no manual configuration steps required. Start writing PromQL queries and alerting rules immediately after instance launch, eliminating the typical setup overhead of deploying Prometheus from scratch.
- Dedicated EBS data volume keeps your Prometheus TSDB independent from the root filesystem, persisted via stable UUID-based fstab entries. This architecture means your monitoring history survives instance stops, restarts, and replacements without data loss. Resize storage independently as your retention needs grow, without replacing compute resources or risking time series corruption during volume operations.
- 24/7 technical support from cloudimg engineers with a one-hour average response time for critical issues. Get expert help with PromQL query optimization, alerting rule design, retention tuning, Grafana integration, and scrape target configuration. Unlike generic cloud support, cloudimg specializes in Prometheus operations - helping you move from basic metrics collection to a production-grade observability stack.
Related Technologies
Related Products

Apache Airflow - Workflow Orchestration
This image runs Apache Airflow as a single node deployment. Airflow is installed into a dedicated Python virtual environ...
Apache Archiva Repository Manager
This image runs Apache Archiva, the open source build-artifact repository manager - a central, governed store for the bi...
Appsmith Open-Source Low-Code Platform
This image runs Appsmith Community Edition, the open source low-code platform for building internal tools, admin panels,...
Appwrite
Appwrite is an open source backend as a service platform, a self-hosted Firebase alternative that gives developers a com...
changedetection.io - Website Change Monitor
This image runs changedetection.io, the self-hosted service that monitors web pages for changes and notifies you when so...
CloudBeaver - Web Database Manager
CloudBeaver CE is a web-based database manager - a browser edition of the popular DBeaver desktop tool - that lets you c...