Telegraf
Overview
Telegraf, the open source plugin-driven server agent for collecting and reporting metrics, preinstalled and running as a system service with a working sample pipeline and the built-in Prometheus metrics endpoint enabled. Edit the pipeline to collect metrics, events and logs from your systems and ship them to your destinations within minutes of launch. Backed by 24/7 cloudimg support.
See it running
Real screenshots of this software running on the cloudimg image, taken while testing the deployment guide.
Description
This is a repackaged open source software product wherein additional charges apply for cloudimg support services.
Overview
Telegraf is an open source, plugin-driven server agent for collecting and reporting metrics, events and logs. With hundreds of input plugins it gathers telemetry from the host, containers, databases, message queues, cloud services and any StatsD, SNMP, Prometheus or HTTP source, processes and aggregates it, then writes it to dozens of output destinations including InfluxDB, Prometheus, Graphite, Kafka, CloudWatch, OpenTSDB and any HTTP endpoint. This image delivers Telegraf fully installed and running as a system service with a working sample pipeline, so a metrics-collection appliance is reporting telemetry within minutes of launch.
Metrics Agent Service
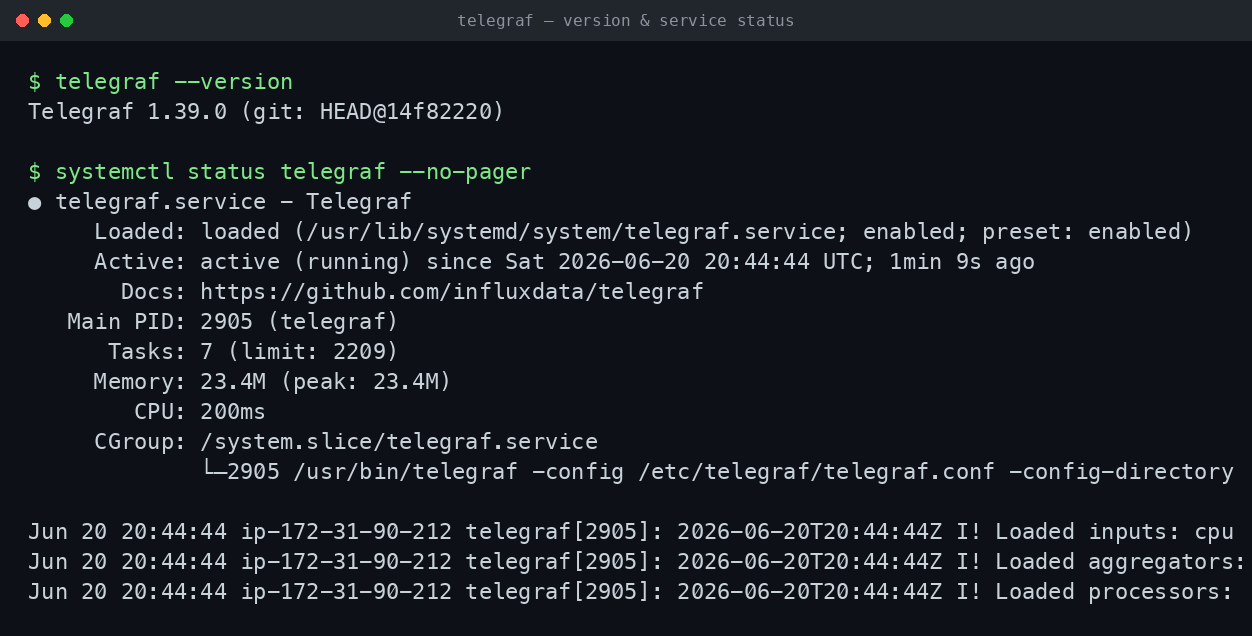
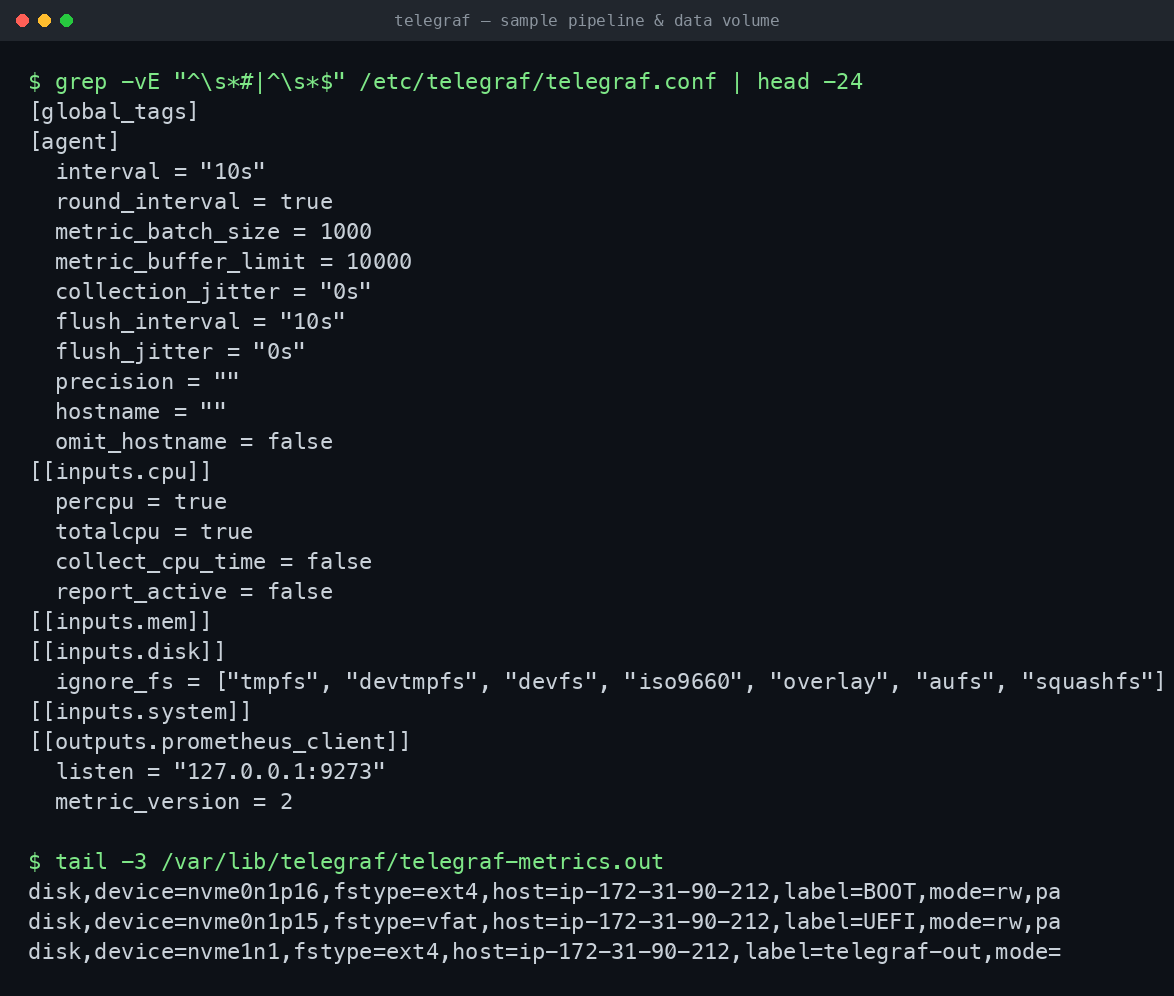
The telegraf daemon installed from the official InfluxData package repository and run by the bundled systemd service, started on boot and restarted on failure. A self-contained sample pipeline ships ready to run, collecting host CPU, memory, disk and system metrics into a Prometheus output and a file output, so you can confirm the agent is producing metrics the moment you log in. Replace the sample inputs and outputs with your own to start collecting and shipping your real telemetry.
Built-in Prometheus Endpoint
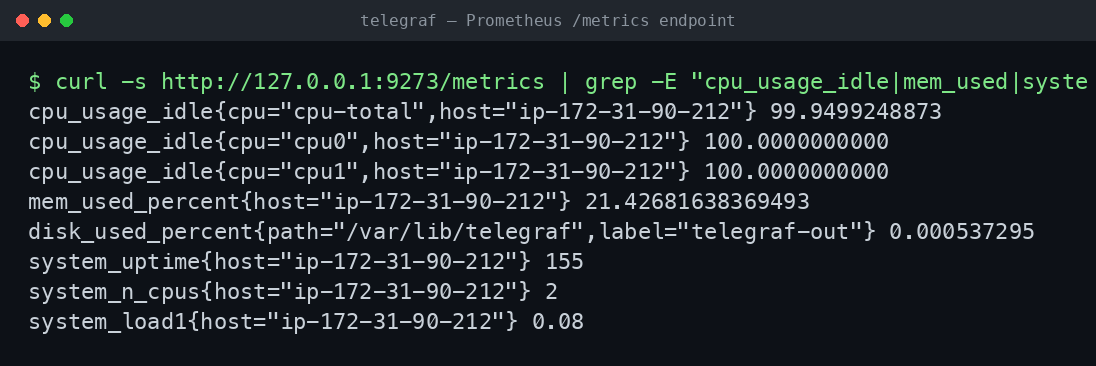
The built-in Prometheus client output is enabled and bound to loopback, so a standard Prometheus exposition endpoint answers on the instance with the live host metrics. Scrape it from your Prometheus server, wire it into a health check, or expose it on your own terms. No web interface to secure: the metrics endpoint is read-only and stays private by default.
Configurable Pipeline
Telegraf reads its pipeline from a simple TOML configuration file and a drop-in directory. Enable input plugins to collect host, container, database, queue, cloud and protocol metrics; chain processor and aggregator plugins to transform, enrich and roll up the stream; and fan out to multiple output plugins in parallel. A vast plugin ecosystem ships in the single static binary, so most sources and destinations need only a configuration block, no extra installs.
Ready To Use
Connect over SSH and the agent is already running. Read the welcome notes, edit the configuration file or drop a snippet into the configuration directory, point the inputs at your sources and the outputs at your destinations, then reload the service. The sample file output lives on a dedicated, independently resizable data disk.
cloudimg Support
24/7 technical support by email and chat. Help with input and output plugin configuration, processors and aggregators, tagging and filtering, metric buffering, routing to your observability backend and upgrade planning.
Use Cases
A host and infrastructure metrics agent shipping telemetry to your time-series database. A metrics collector scraping databases, message queues and cloud services. A protocol bridge translating StatsD, SNMP or Prometheus into your observability backend. A lightweight, single-binary agent for cloud-native and edge monitoring.
All product and company names are trademarks or registered trademarks of their respective holders. Use of them does not imply any affiliation with or endorsement by them.
Key Features
- Telegraf, the MIT-licensed open source plugin-driven server agent for collecting and reporting metrics, preinstalled and running as a systemd service with a working sample pipeline, no manual setup required
- The built-in Prometheus client output is enabled on loopback serving a standard exposition endpoint of live host metrics, and a sample file output on a dedicated, independently resizable data disk persists the metric stream
- Enable plugins in a simple TOML configuration to collect metrics, events and logs from hundreds of sources and route them to dozens of destinations, with 24/7 technical support from cloudimg