Base
Hardened build
minimal ports, security patches applied at build time

Self hosted, eBPF based observability and APM: metrics, traces, logs and continuous profiling with automatic service maps, packaged by cloudimg.
Coroot Community Edition is an open source observability and application performance monitoring platform built on eBPF. A zero instrumentation node agent captures metrics, distributed traces, logs and continuous CPU profiles straight from the Linux kernel, and Coroot correlates them into automatic service maps, health and latency SLOs, incident detection and root cause hints, all explorable from a built in web dashboard. It bundles its own Prometheus metrics store and ClickHouse telemetry store, so a single instance gives you a full picture of how your services talk to each other and where time and errors are spent, without adding tracing libraries to your code.
It suits platform and SRE teams that want deep, code free visibility into their services inside their own cloud account, with the privacy and control of self hosting.
cloudimg delivers Coroot fully installed and running as four official upstream containers pinned by digest under one systemd service, fronted by nginx. A unique Coroot admin password and a separate ClickHouse password are generated on each instance's first boot, so nothing is baked into the image and no two deployments share a credential. All telemetry lives on a dedicated, independently resizable data volume rather than the OS disk, the eBPF node agent starts collecting the instance's own telemetry automatically, and every image is paired with a step by step deploy guide and backed by 24/7 cloudimg support.
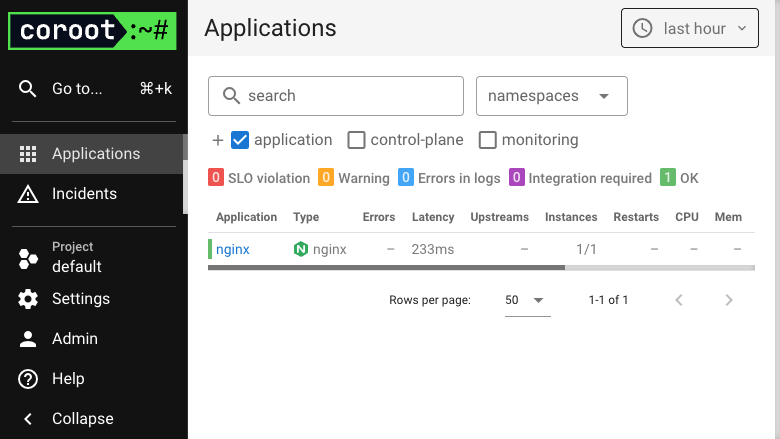
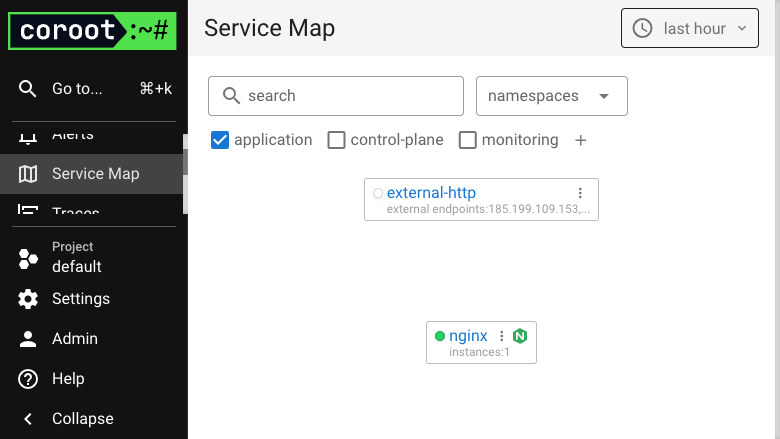
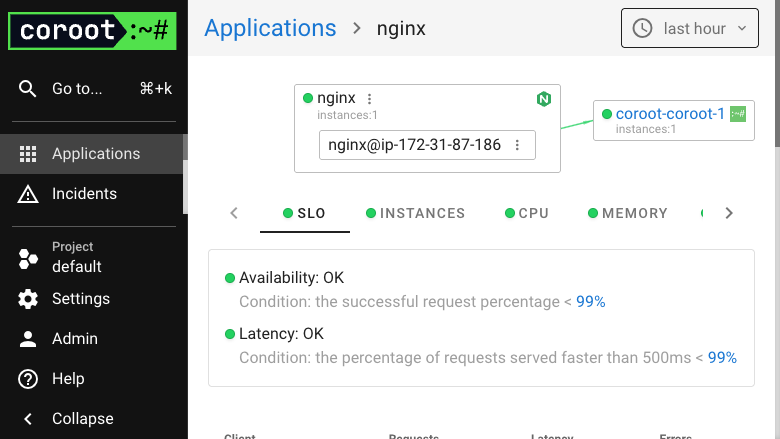
Real screenshots taken while testing this image against its deployment guide.
This is a repackaged open source software product wherein additional charges apply for cloudimg support services.
## Overview
Coroot is an open source, eBPF-based observability and application performance monitoring (APM) platform. A zero-instrumentation node agent uses eBPF to collect metrics, distributed traces, logs and continuous profiles directly from the Linux kernel - no code changes or SDKs required - and Coroot correlates them into automatic service maps, latency and error dashboards, SLO tracking and cost monitoring, all in a built-in web UI. This AMI delivers a fully installed, security-hardened Coroot Community Edition appliance so a working observability stack is operational within minutes of launch, running entirely in your own AWS account.
## Why This Image vs a Manual Install
This image eliminates the multi-container orchestration, reverse-proxy configuration, datastore tuning and credential hardening that a bare install requires. Coroot is delivered as four official upstream containers - the Coroot server, the privileged eBPF node agent, a bundled Prometheus store and a bundled ClickHouse store for traces, logs and profiles - pinned by image digest and run unmodified under a single systemd unit on a private Docker network. An nginx reverse proxy fronts the web UI, and a unique Coroot admin password (plus a unique ClickHouse password) is generated on each instance's first boot, so no two deployments share a credential and nothing is baked in. Launch the instance, read your unique credential, and the node agent begins populating the service map with real telemetry automatically.
## Application Stack
The Coroot server and web UI, the eBPF node agent, Prometheus and ClickHouse run as pinned-by-digest containers via docker compose under one systemd service on a private network. The Coroot server binds to loopback only; Prometheus and ClickHouse are never published to a host port. An nginx reverse proxy on port 80 forwards to the Coroot UI and exposes an unauthenticated health endpoint for load-balancer probes. All container data - the Coroot store, ClickHouse, Prometheus and the node-agent write-ahead log - lives on a dedicated, resizable EBS data volume mounted at the Docker data-root, off the OS disk. systemd starts the stack on boot and restarts it on failure.
## Security Hardening
This image follows a defence-in-depth approach:
Buyers requiring formal compliance documentation should contact cloudimg to discuss specific requirements.
## Concrete Use Cases
## AWS Integration
Deploy on any EC2 instance type that meets the datastores' memory needs; m5.large or larger is recommended. Grow the EBS data volume as retention needs increase, use the health endpoint with an Application Load Balancer, and snapshot the data volume with AWS Backup. Coroot self-monitors the instance it runs on, so the service map populates automatically once the instance is up.
## Getting Started
Read your credential from the root-only file, open the web interface, sign in as the admin user, and watch the service map and dashboards fill with the instance's own telemetry within a couple of minutes. Install the node agent on your other hosts to widen coverage.
## cloudimg Support
24/7 technical support by email and chat. Help with deployment, reverse-proxy TLS termination with your own domain, widening telemetry coverage, datastore tuning, and interpreting service maps, traces and SLOs.

This image runs AWStats, the long established open source log file analyser, behind the Apache web server with mod_cgid ...
This image runs CheckCle, the open source self-hosted uptime and infrastructure monitoring platform.

Gatus pre-configured behind an nginx reverse proxy: an automated health and uptime monitoring dashboard and status page ...

This AMI runs GoAlert 0.34.1, the open source on-call scheduling and alerting platform maintained by Target.

Launch a production-ready OpenTelemetry Collector in minutes - pre-secured with per-instance auth, nginx reverse proxy, ...

Nezha is an open source, lightweight tool for monitoring your servers and websites: a real time status dashboard, HTTP, ...