GreptimeDB
Overview
GreptimeDB, the open source unified time series database for metrics, logs and traces with SQL and PromQL, preinstalled as a system service with the built in web dashboard published on port 80 behind an authenticating nginx proxy. A unique admin password is generated on first boot. Backed by 24/7 cloudimg support.
See it running
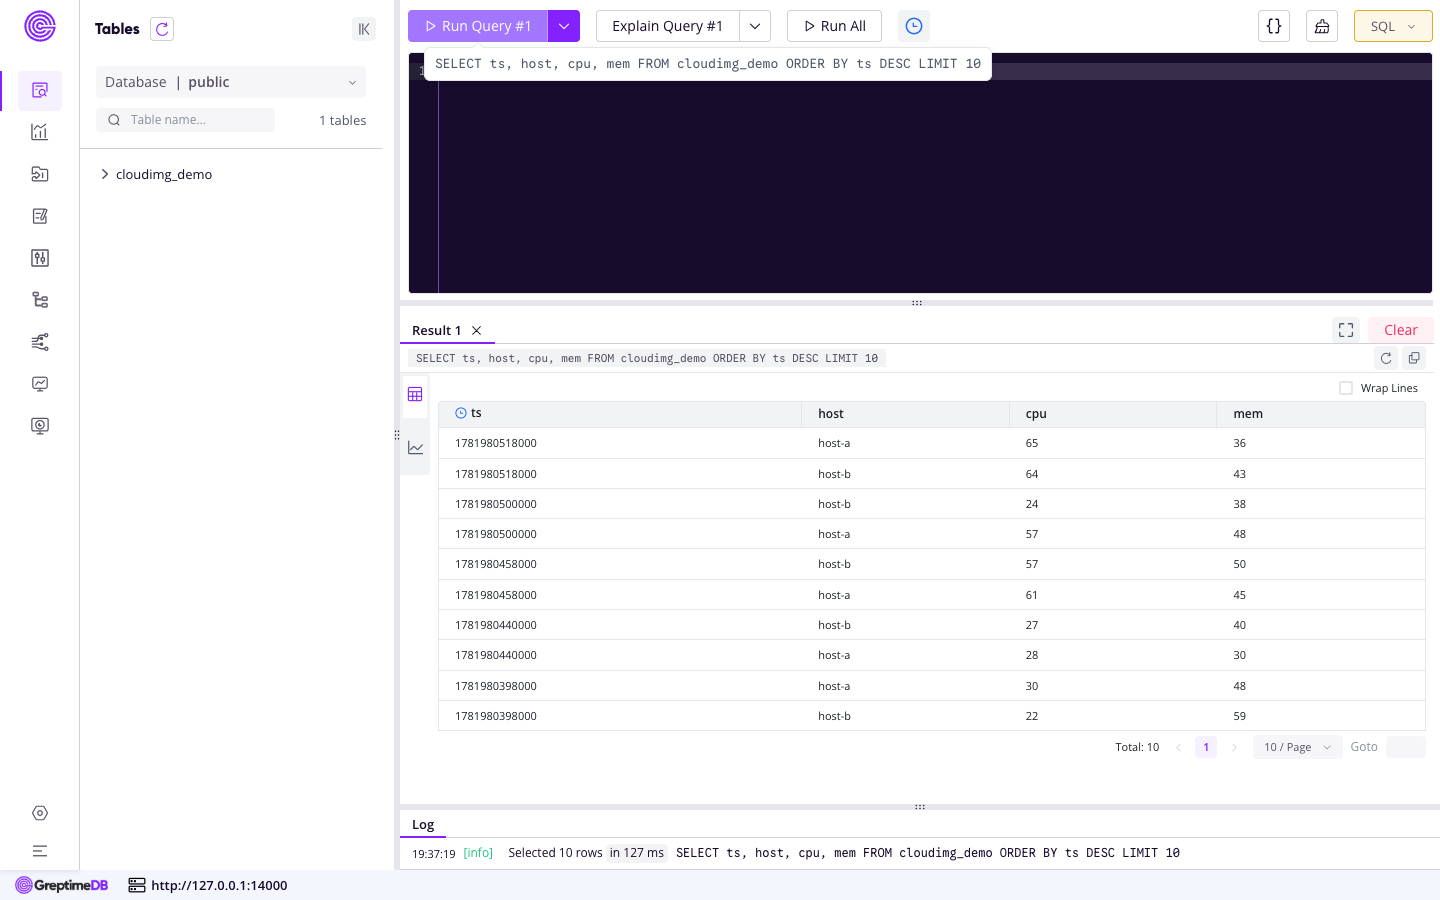
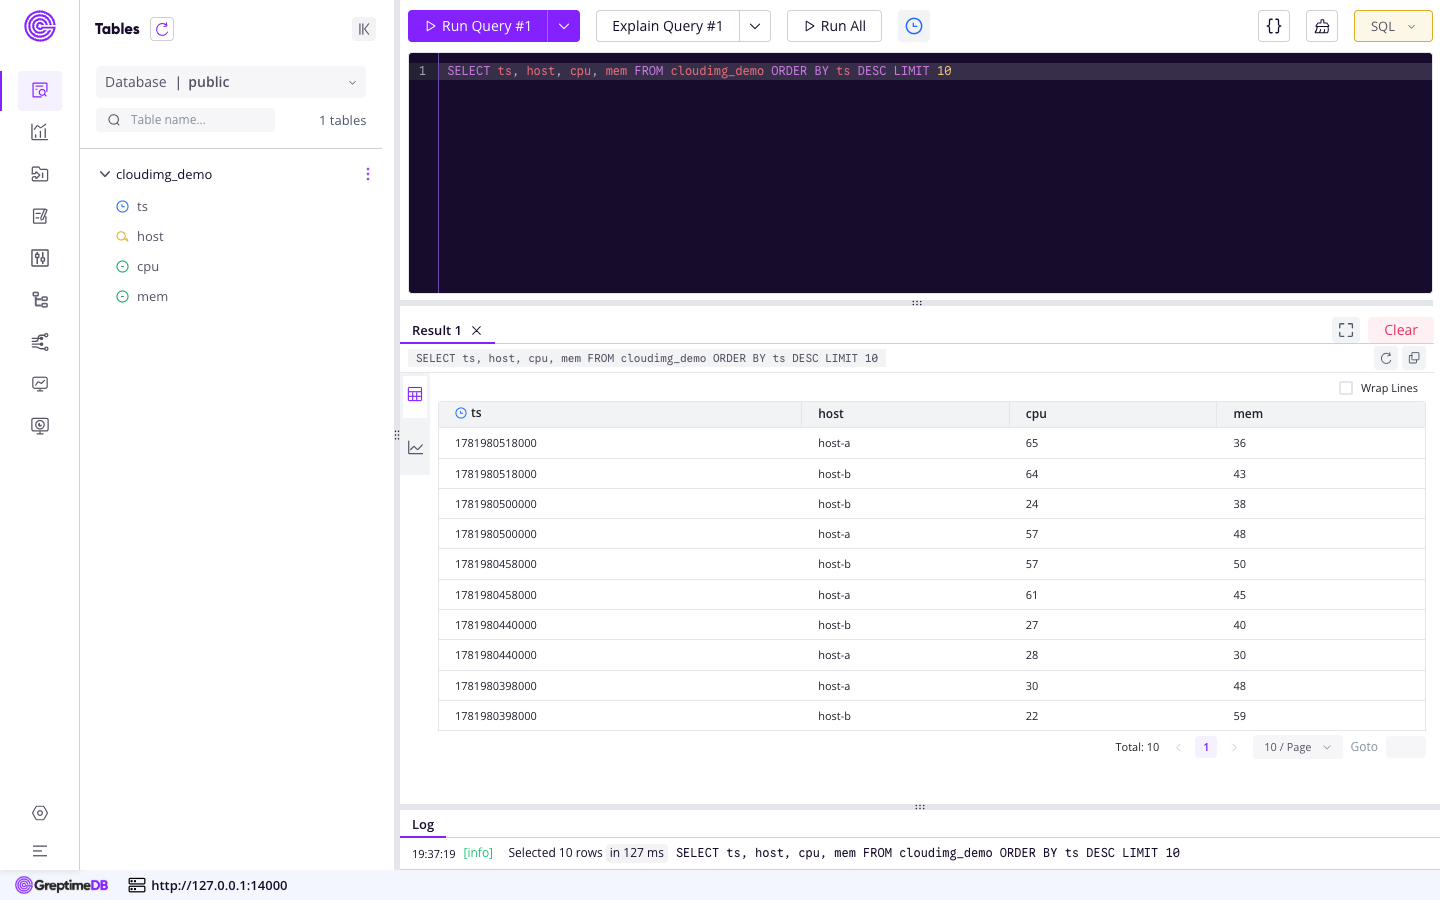
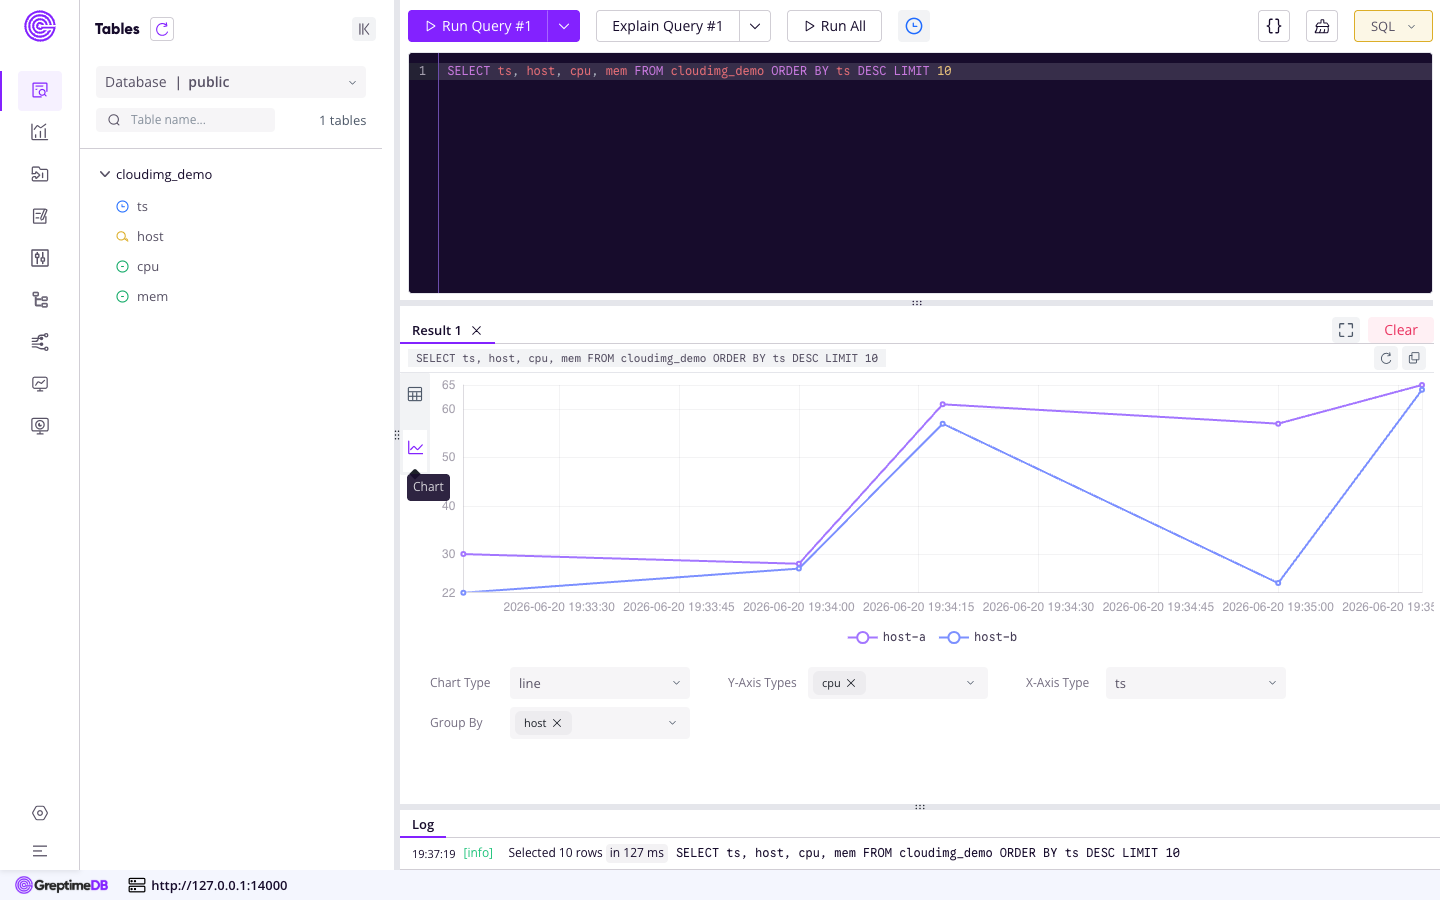
Real screenshots of this software running on the cloudimg image, taken while testing the deployment guide.
Description
This is a repackaged open source software product wherein additional charges apply for cloudimg support services.
Overview
GreptimeDB is a fast, open source, unified observability database for metrics, logs and traces. It speaks SQL and PromQL, ingests over the MySQL and PostgreSQL wire protocols, the Prometheus remote write protocol, the Influx line protocol, OpenTelemetry and its own HTTP API, and stores everything in one engine on cost effective object friendly storage. This image delivers the GreptimeDB standalone build fully installed and configured as a system service, with the built in web dashboard published behind authentication, so a production grade observability database is running within minutes of launch.
Application Stack
The GreptimeDB standalone binary installed under /opt/greptimedb and run by a dedicated unprivileged service account. The database storage on a dedicated data disk so the time series store is independently resizable. A systemd service that starts the database on boot and restarts it on failure. An nginx reverse proxy that publishes the web dashboard and the SQL, PromQL and ingest APIs on port 80 behind HTTP Basic authentication.
Unified Observability Database
Store metrics, logs and traces together in one engine and query them with SQL or PromQL. Ingest over the MySQL and PostgreSQL wire protocols, the Prometheus remote write protocol, the Influx line protocol, OpenTelemetry or the HTTP API, then explore the data in the built in dashboard, run queries from any MySQL or PostgreSQL client, or wire it into Grafana. GreptimeDB uses columnar storage and aggressive compression to keep long retention observability data on modest disk.
Secure First Boot
On the first boot of your instance a one shot service generates a fresh admin password, unique to that instance, writes it into the nginx credentials file and writes the password to a root only file. The database binds to loopback only and is never exposed without authentication. No shared or default credentials ship in the image.
Ready To Use
The web dashboard is served on port 80 through nginx. Sign in with the generated administrator credentials to run SQL and PromQL queries, browse tables and schemas, and inspect ingested data in the query console. A demo table is seeded on first boot so there is data to explore immediately. Point your Prometheus remote write, your MySQL or PostgreSQL client, or your Grafana data source at the instance on port 80 using the same credentials.
cloudimg Support
24/7 technical support by email and chat. Help with deployment, ingestion protocol configuration, retention and compaction, SQL and PromQL queries, Grafana integration, TLS and storage tuning.
Use Cases
A unified backend for metrics, logs and traces. Long term Prometheus remote storage. A single node observability database for Grafana dashboards. Application and infrastructure monitoring. IoT and sensor telemetry storage. A cost effective alternative to hosted observability backends.
All product and company names are trademarks or registered trademarks of their respective holders. Use of them does not imply any affiliation with or endorsement by them.
Key Features
- GreptimeDB unified time series database for metrics, logs and traces preinstalled as a systemd service with the built in web dashboard and the SQL, PromQL and ingest APIs published on port 80, no manual setup required
- Ingests Prometheus remote write, Influx, OpenTelemetry and the MySQL and PostgreSQL wire protocols and answers SQL and PromQL queries, with the database on a dedicated independently resizable data disk
- Hardened first boot generates a fresh admin password for every instance behind an authenticating nginx proxy and stores it in a file only the root user can read, with 24/7 technical support from cloudimg