
VictoriaMetrics Time Series Database
Overview
Production-ready VictoriaMetrics time series database preinstalled as a systemd service with vmui and authenticating nginx proxy. Backed by 24/7 cloudimg support.
See it running
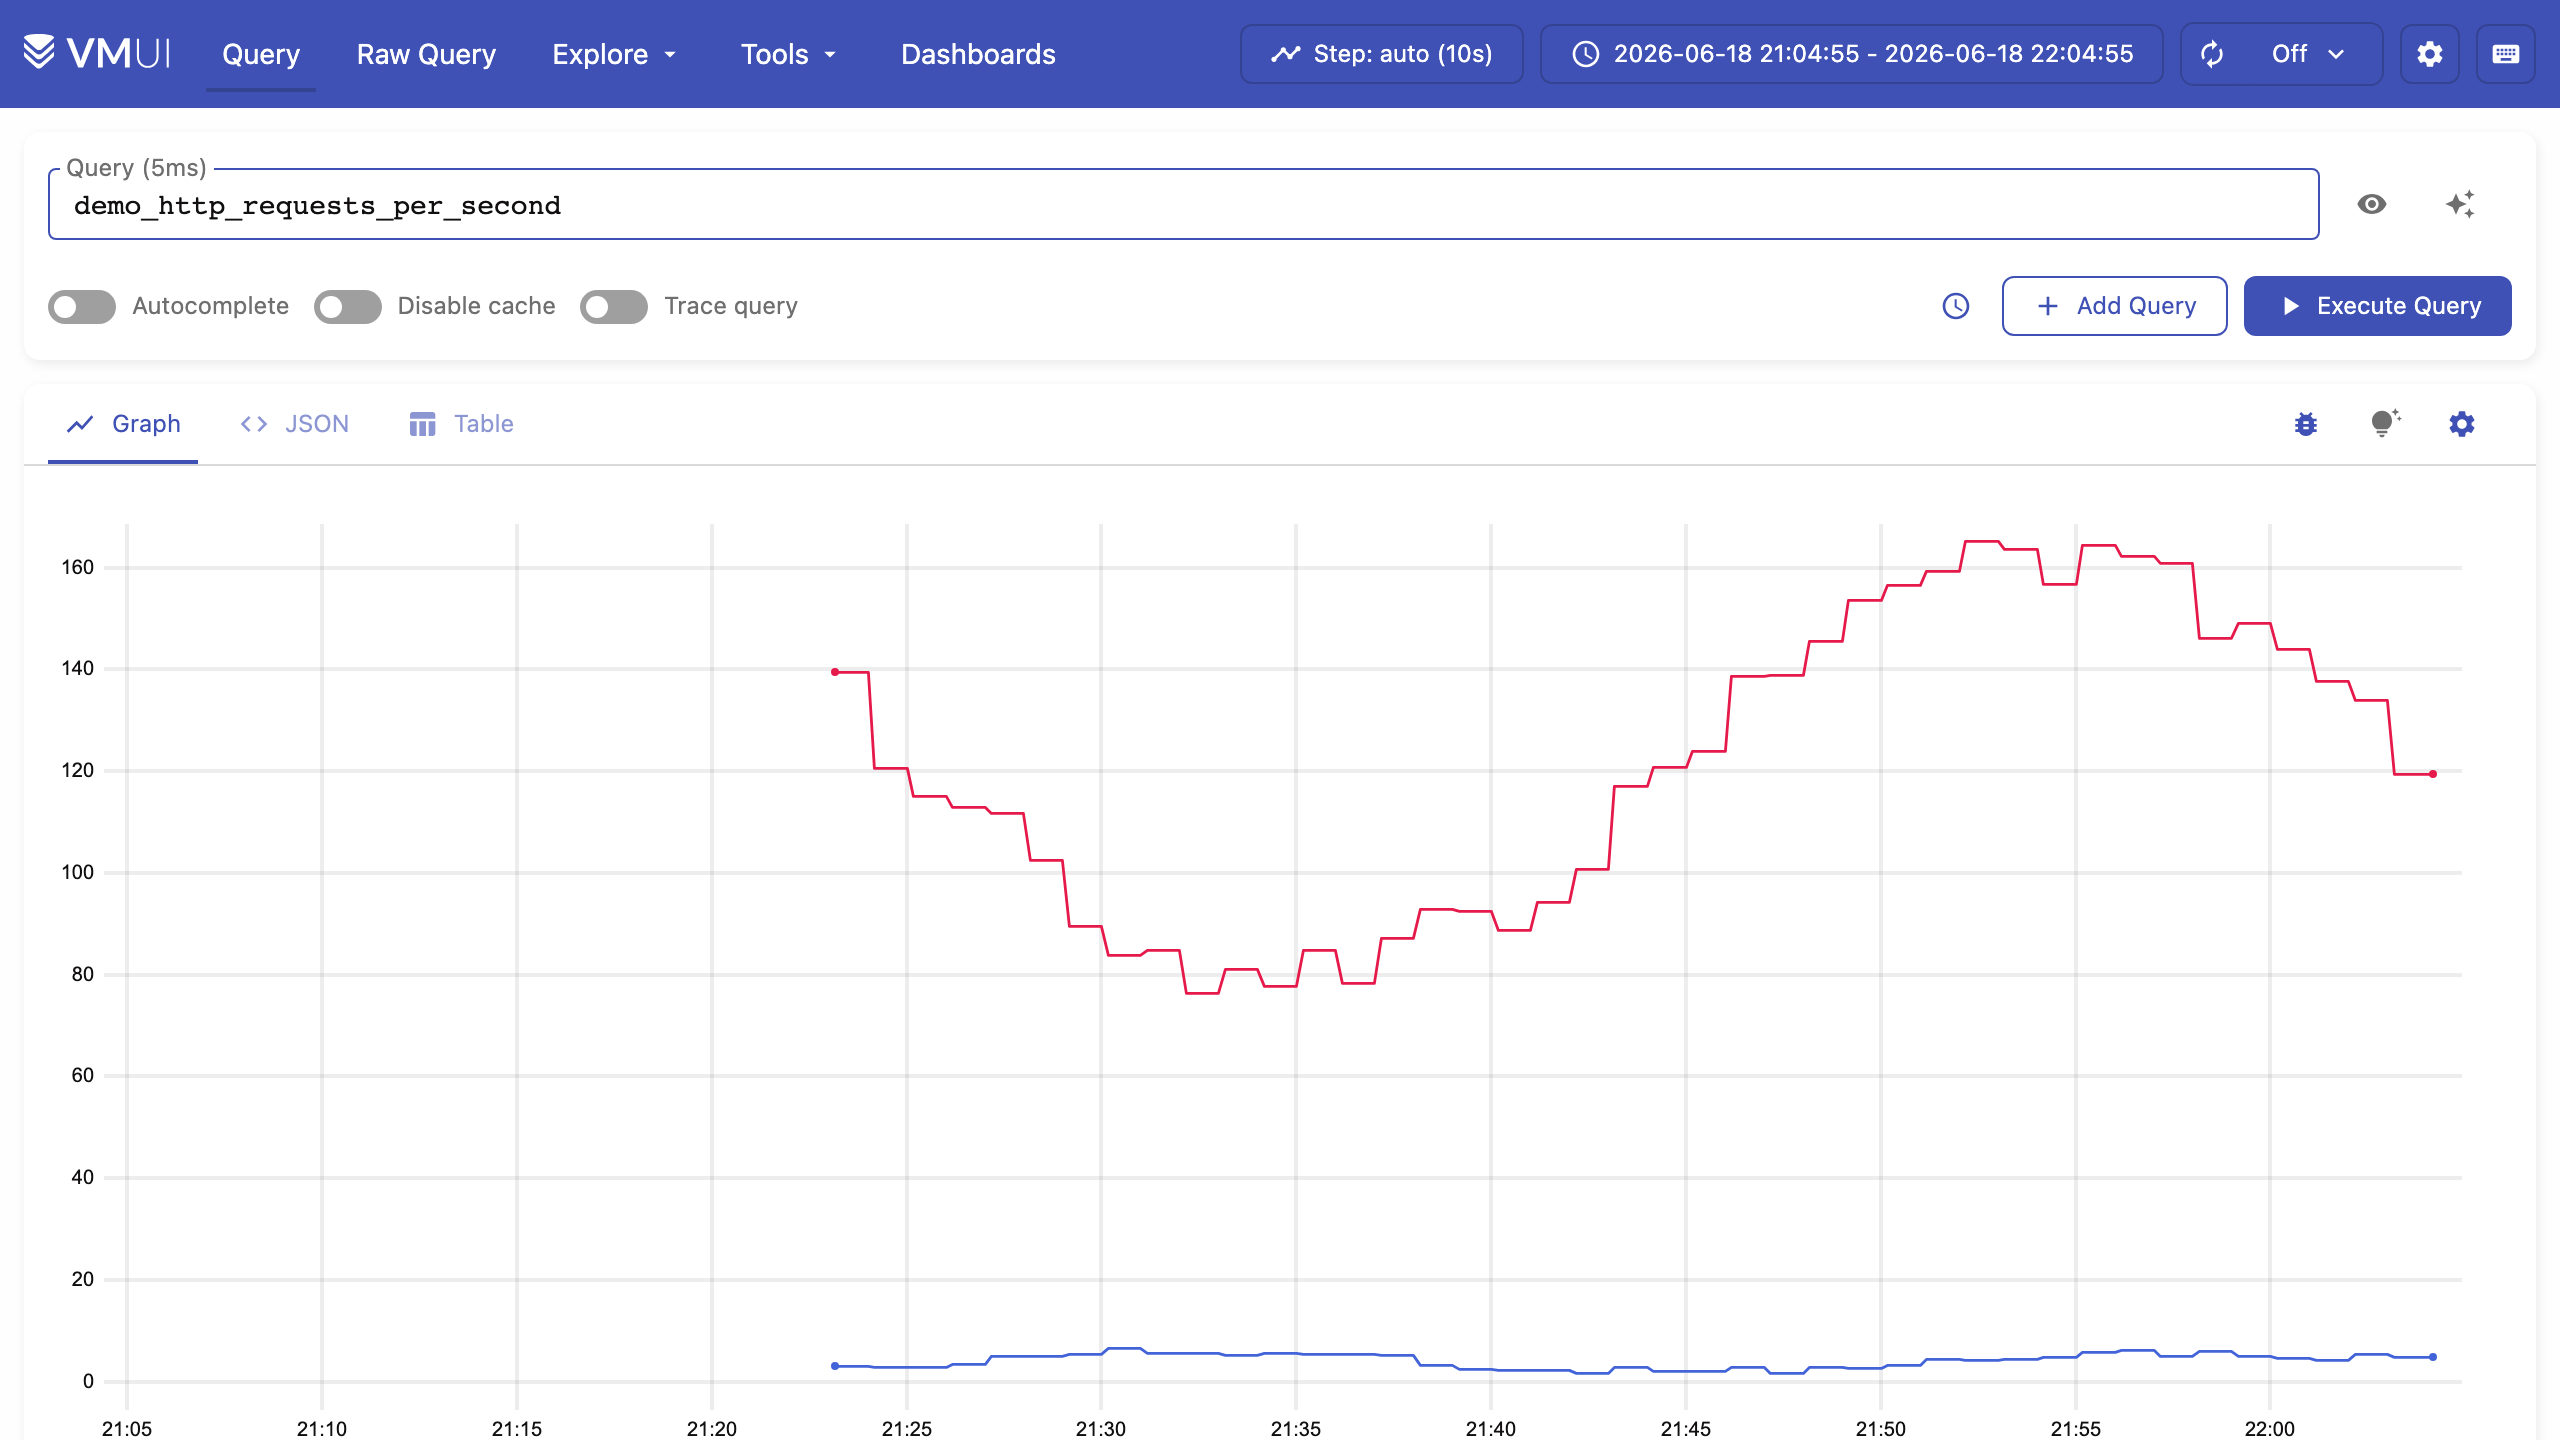
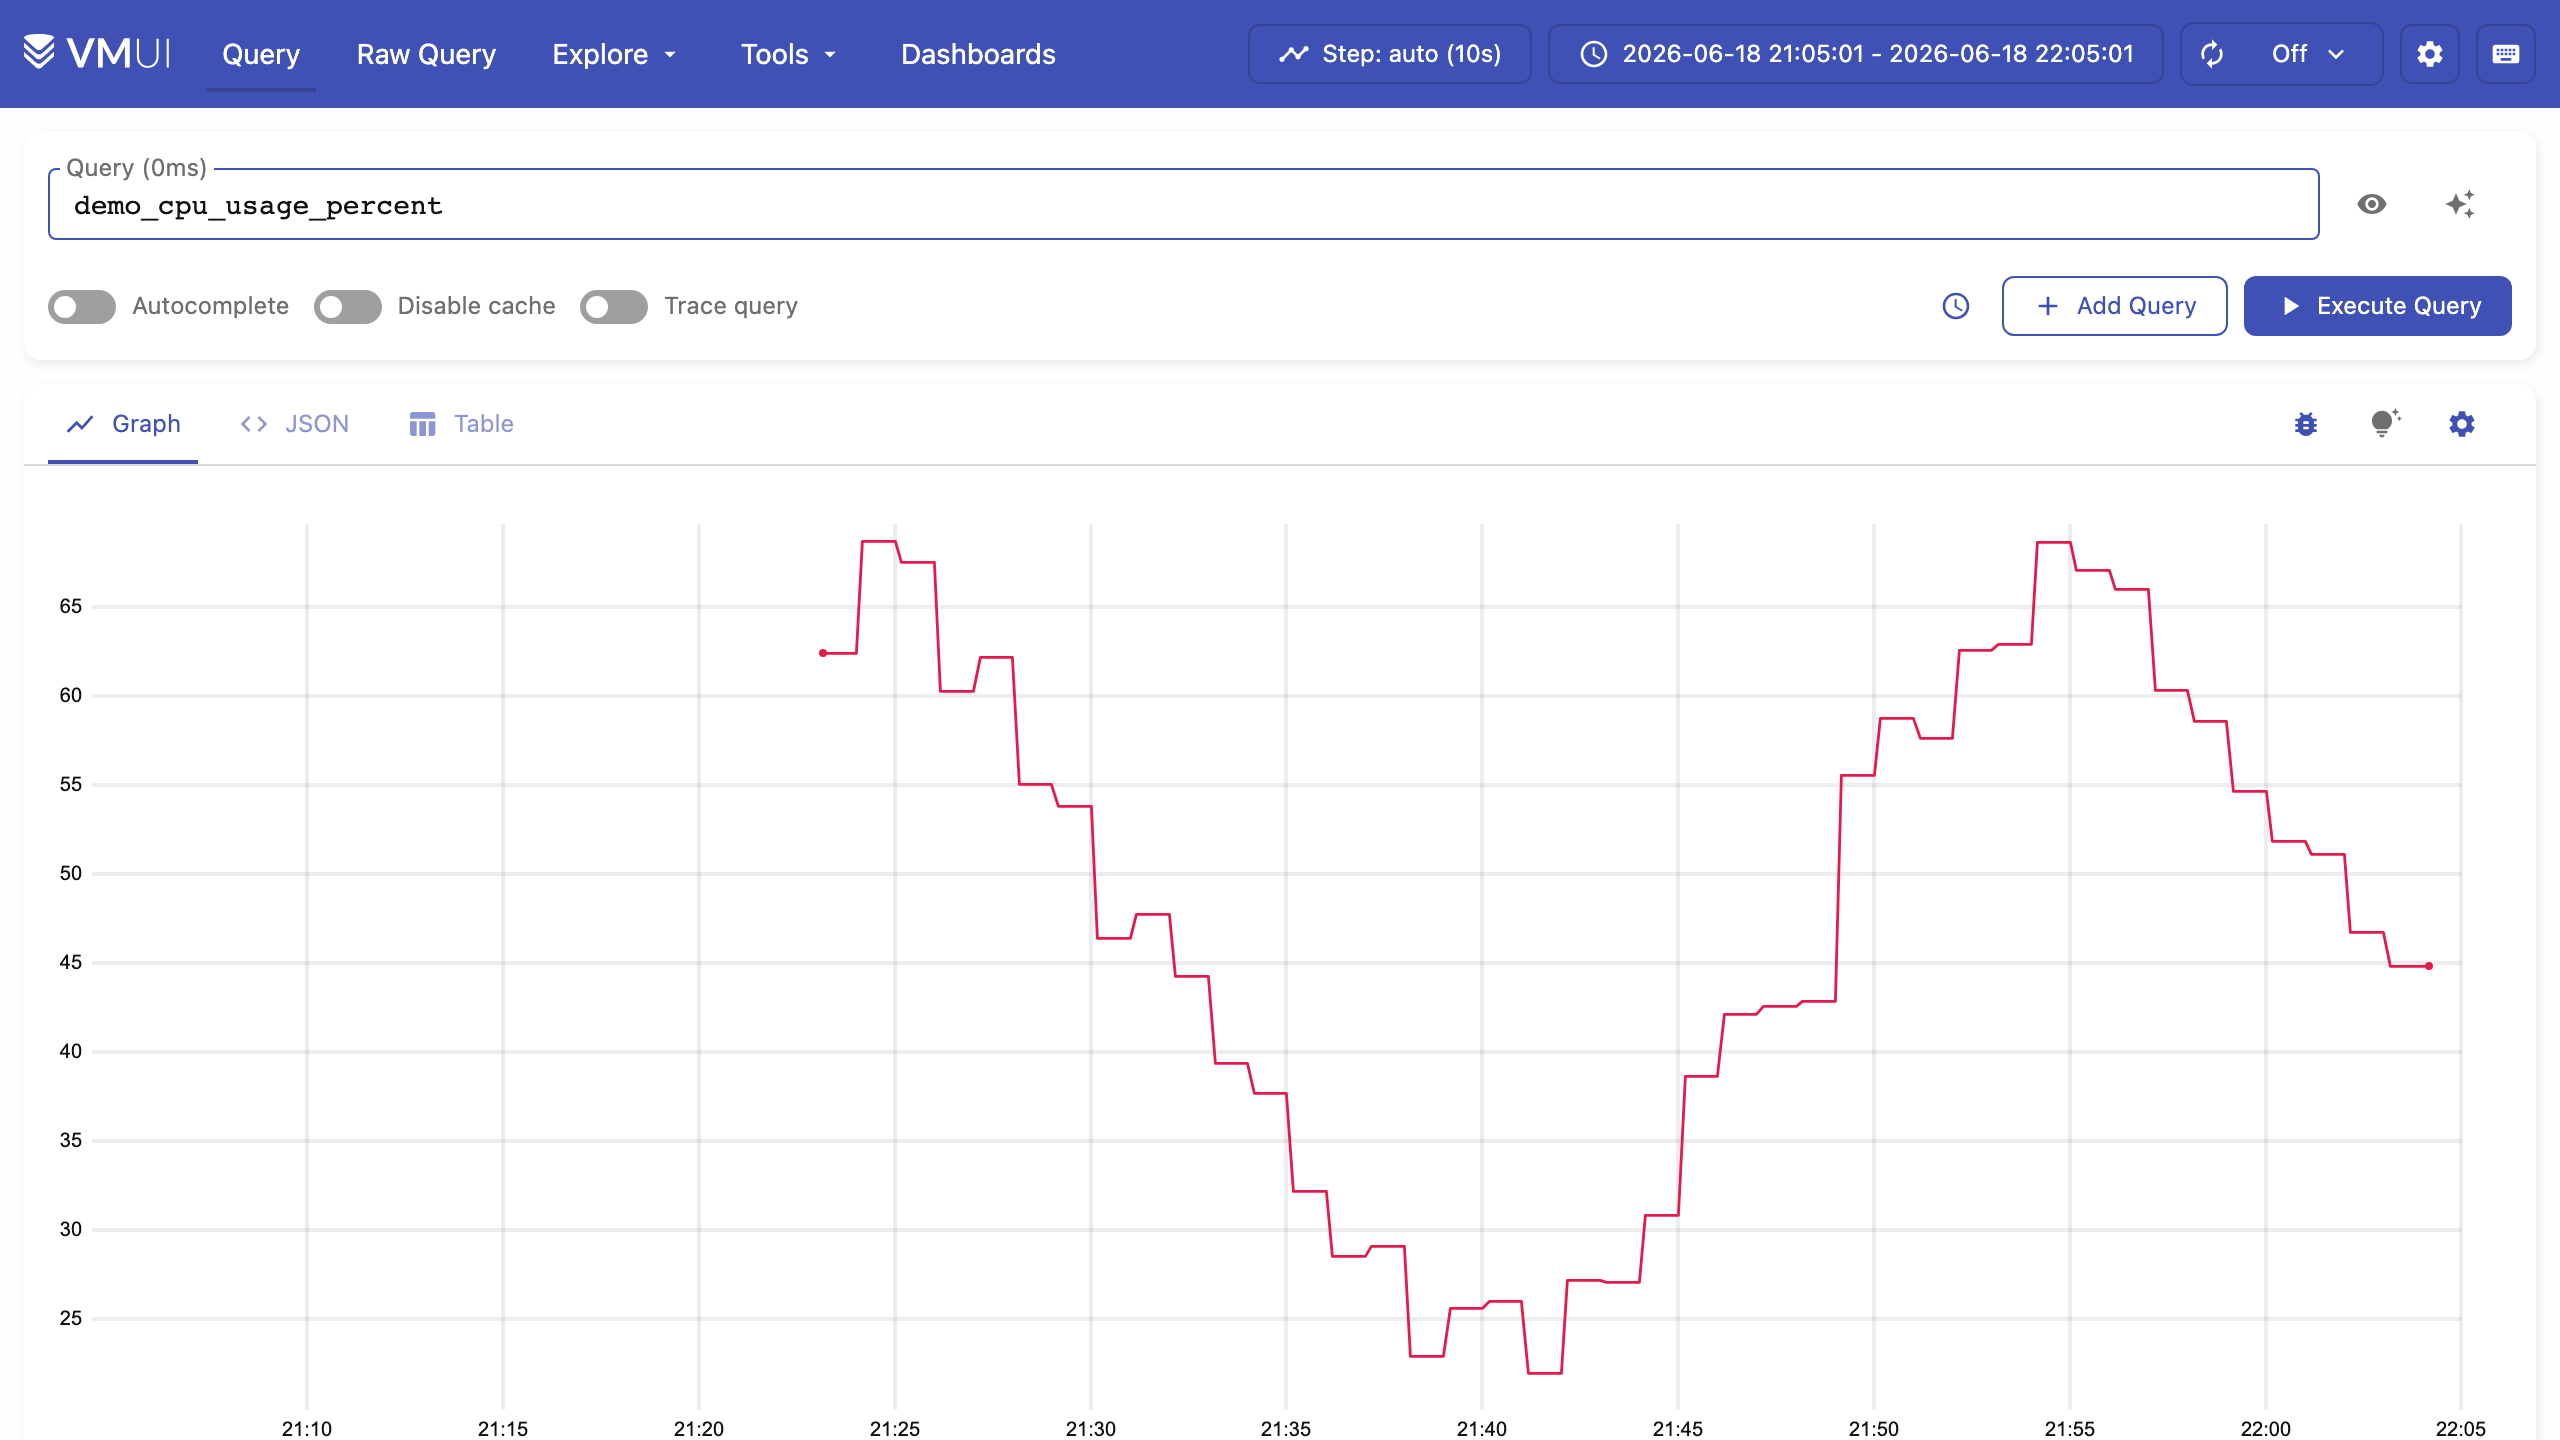
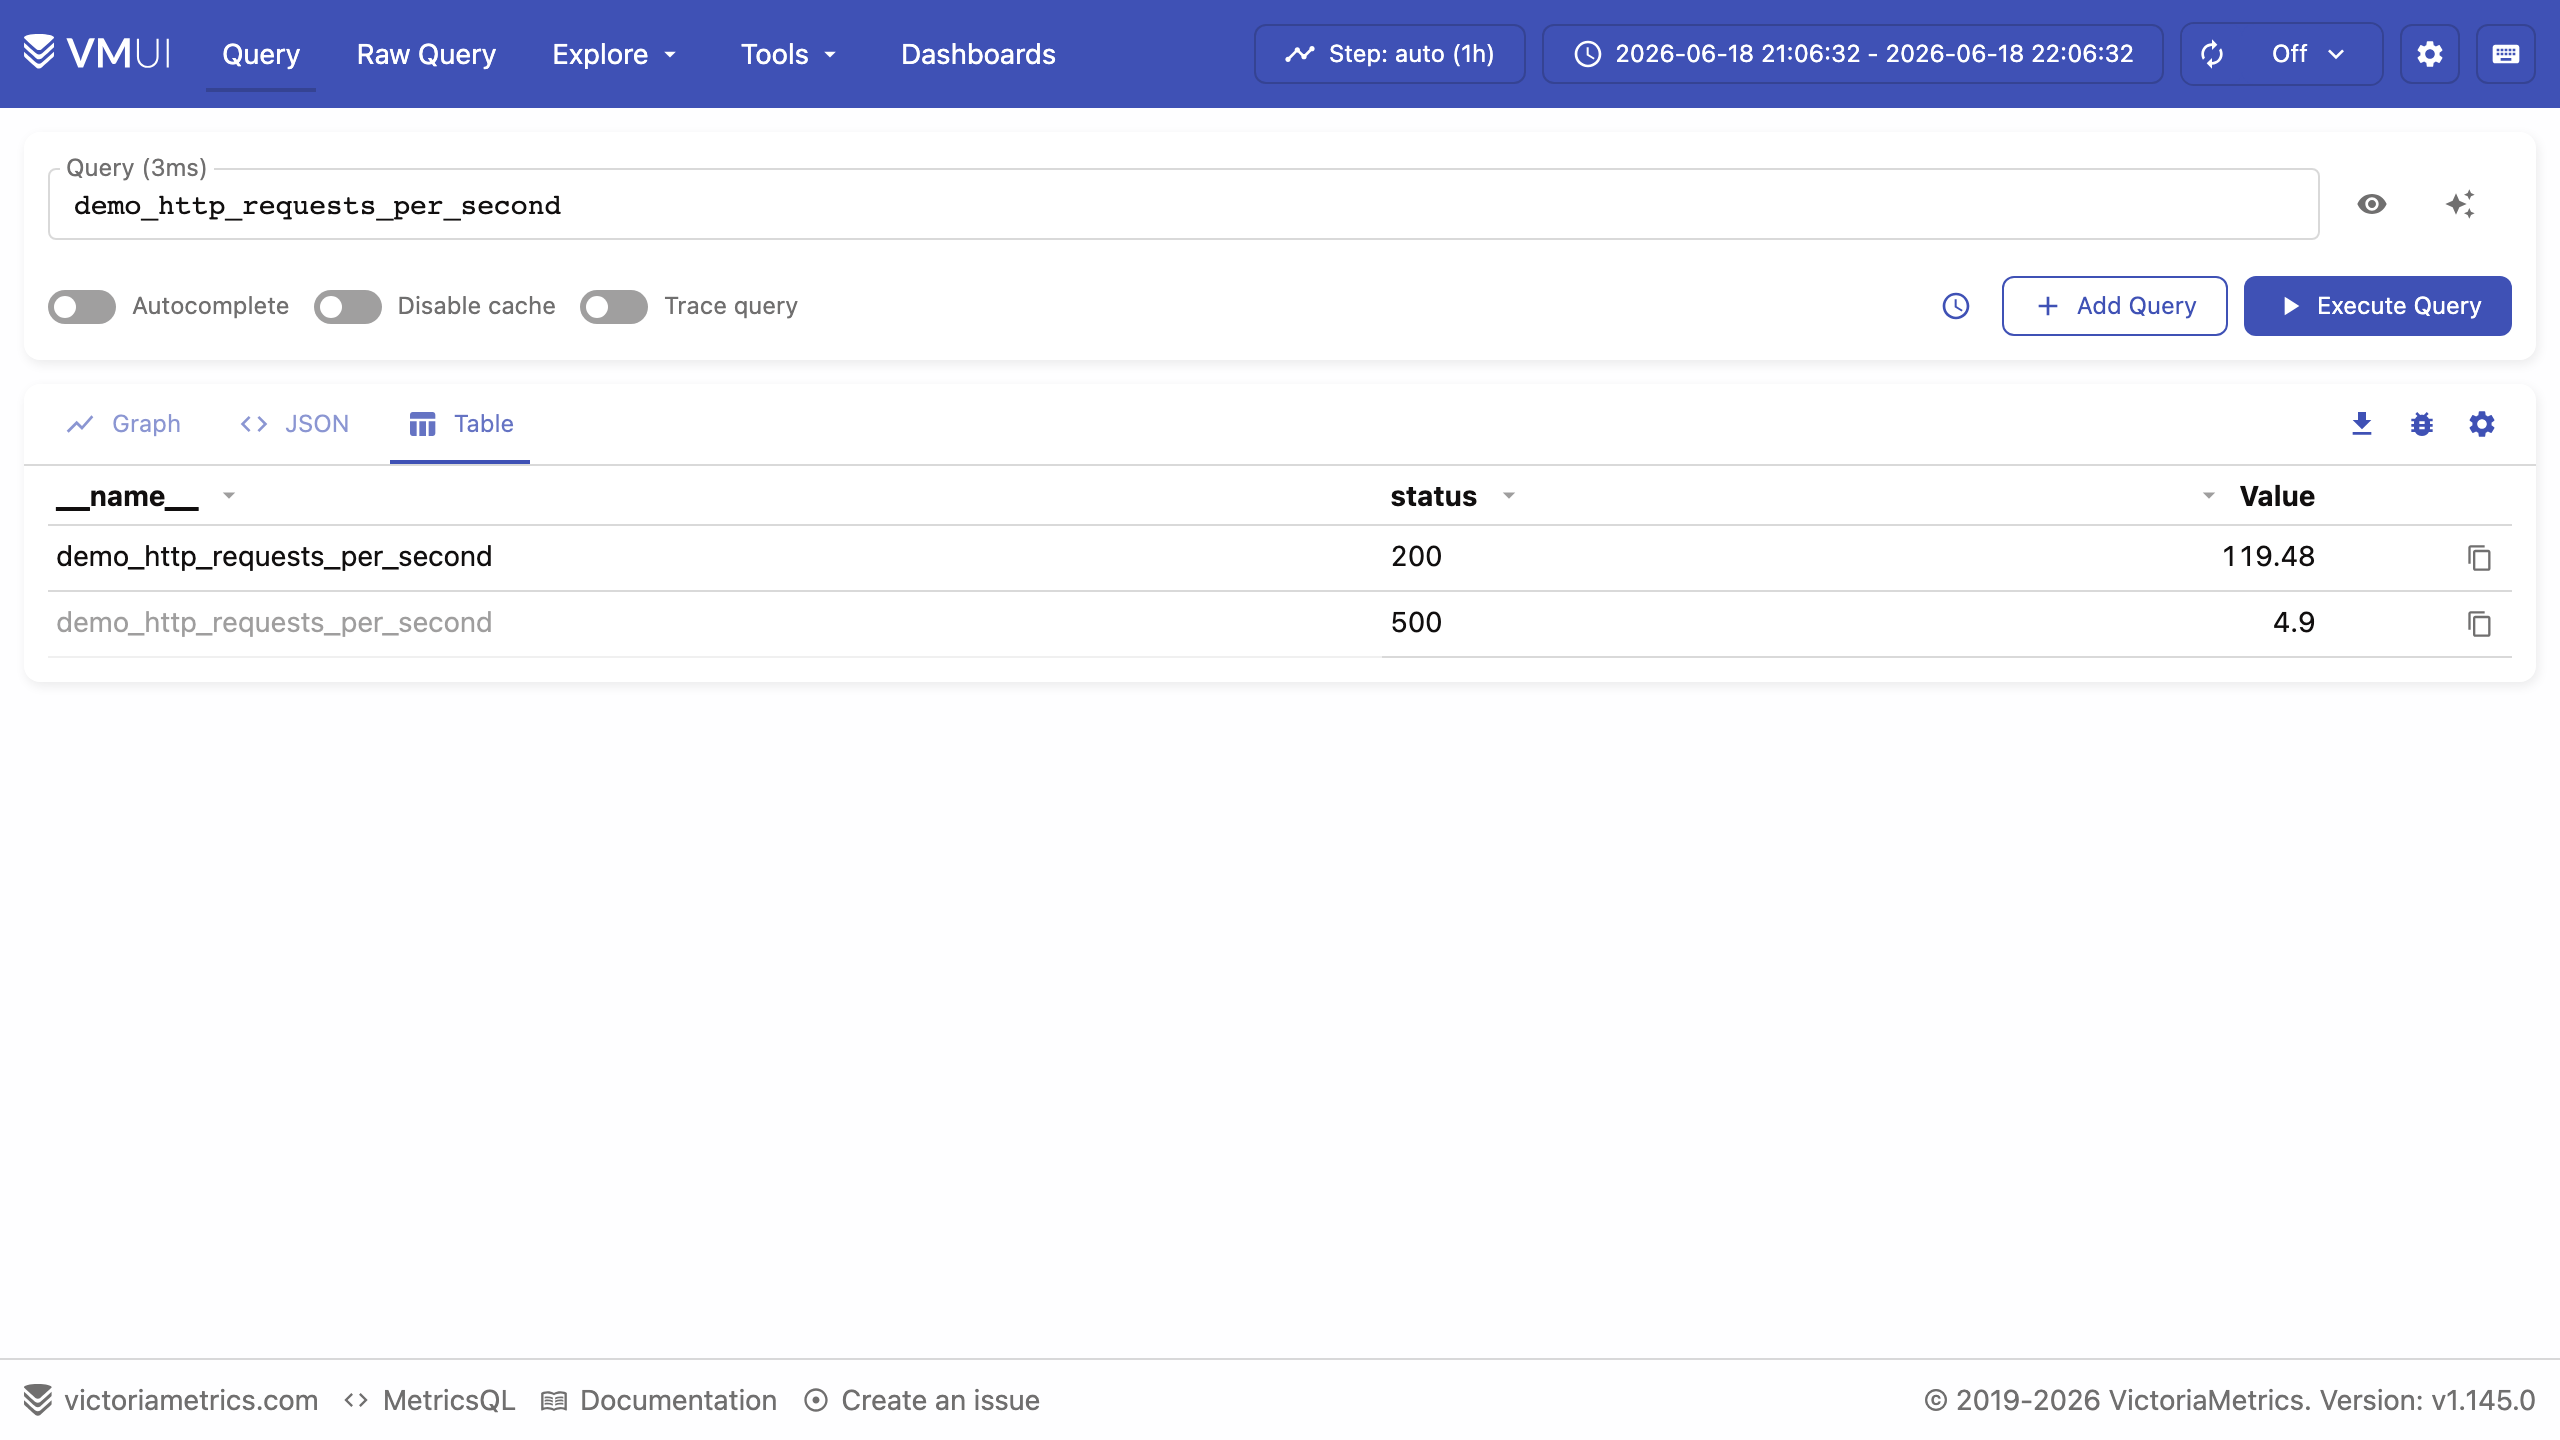
Real screenshots of this software running on the cloudimg image, taken while testing the deployment guide.
Description
This is a repackaged open source software product wherein additional charges apply for cloudimg support services.
## VictoriaMetrics Single-Node Time Series Database - Supported by cloudimg
A production-grade metrics database running within minutes of launch. VictoriaMetrics is a fast, cost-effective and scalable open-source time series database that serves as a drop-in replacement for Prometheus remote storage - accepting data over Prometheus remote write, Influx line protocol, Graphite, OpenTSDB and CSV protocols, and answering queries in MetricsQL, a backwards-compatible PromQL superset with additional functions for advanced analytics.
## Why VictoriaMetrics Over Alternatives
- Lower storage costs than hosted monitoring backends: VictoriaMetrics uses high compression and an efficient storage engine to keep long-retention metrics on modest disk, reducing your EBS spend compared to self-hosted Prometheus or InfluxDB deployments.
- Broader protocol support than competing AMIs: Ingest from Prometheus, InfluxDB, Graphite and OpenTSDB sources simultaneously without running multiple databases or translation layers.
- MetricsQL superset over plain PromQL: Query with familiar PromQL syntax plus additional functions for rollup calculations, label manipulation and subqueries that Prometheus does not natively support.
- Single-node simplicity versus clustered alternatives: Avoid the operational overhead of Thanos or Cortex sidecars while still achieving production-grade reliability for workloads suited to vertical scaling.
## Application Stack
- The VictoriaMetrics single-node binary installed under /opt/victoriametrics and run by a dedicated unprivileged service account.
- The time series database stored on a dedicated data disk so the metrics store is independently resizable without instance replacement.
- A systemd service that starts the database on boot and restarts it on failure for unattended recovery.
- An nginx reverse proxy that publishes the vmui web interface and the read/write APIs on port 80 behind HTTP Basic authentication.
## Time Series Database
Ingest metrics over the Prometheus remote write protocol, the Influx line protocol, Graphite, OpenTSDB or the JSON and CSV import APIs, then query them with MetricsQL or PromQL through the built-in vmui interface, the Prometheus-compatible HTTP API or your Grafana dashboards.
## Secure First Boot
On the first boot of your instance a one-shot service generates a fresh admin password, unique to that instance, writes it into the nginx credentials file and stores the password in a root-only file. The database binary itself binds to loopback only and is never exposed without authentication. No shared or default credentials ship in the image.
## Ready To Use
The vmui web interface is served on port 80 through nginx. Sign in with the generated administrator credentials to run queries, explore metrics, inspect cardinality and check database health. Point your Prometheus remote write, vmagent or Grafana data source at the instance on port 80 using the same credentials.
## Use Cases
- Long-term Prometheus remote storage: Teams running multiple Prometheus instances can federate long-retention data into a single VictoriaMetrics node, reducing operational complexity and storage costs across environments with millions of active time series.
- Grafana metrics backend: Replace multiple data sources with one VictoriaMetrics endpoint serving dashboards for application latency, infrastructure utilization and business KPIs.
- IoT and sensor telemetry: Collect high-cardinality metrics from edge device fleets - such as manufacturing sensors or connected vehicles - and retain months of history on a single node with efficient compression.
- Cost-effective alternative to hosted monitoring: Avoid per-metric or per-host fees from SaaS monitoring vendors by running your own metrics backend on EC2 with predictable infrastructure costs.
## About cloudimg
cloudimg provides 24/7 technical support for this AMI by email and live chat. Our engineers help with deployment, ingestion protocol configuration, retention and downsampling, MetricsQL queries, Grafana integration, TLS termination and storage tuning.
To get started, launch the AMI, retrieve your generated admin credentials from the root-only file, and begin ingesting metrics immediately.
All product and company names are trademarks or registered trademarks of their respective holders. Use of them does not imply any affiliation with or endorsement by them.
Key Features
- Production-ready in minutes: VictoriaMetrics single-node time series database launches as a systemd service with the vmui web interface and Prometheus-compatible read/write APIs on port 80 - no manual installation, configuration or dependency management required. A dedicated data disk keeps the metrics store independently resizable without instance replacement, so you scale storage without downtime.
- Multi-protocol ingestion with advanced querying: Accept metrics simultaneously from Prometheus remote write, InfluxDB line protocol, Graphite and OpenTSDB sources - eliminating the need for multiple databases or translation layers. Query with MetricsQL, a PromQL superset that adds rollup calculations, label manipulation and subquery functions not available in standard Prometheus, through vmui or Grafana dashboards.
- Hardened security from first boot with 24/7 expert support: Every instance generates a unique admin password on launch, stored in a root-only file, with the database bound to loopback behind an authenticating nginx proxy - no shared or default credentials ever ship. cloudimg provides 24/7 technical support by email and chat covering deployment, protocol configuration, retention tuning, Grafana integration and troubleshooting.