Base
Hardened build
minimal ports, security patches applied at build time

open source uptime, infrastructure and incident monitoring from a single dashboard, packaged and supported by cloudimg
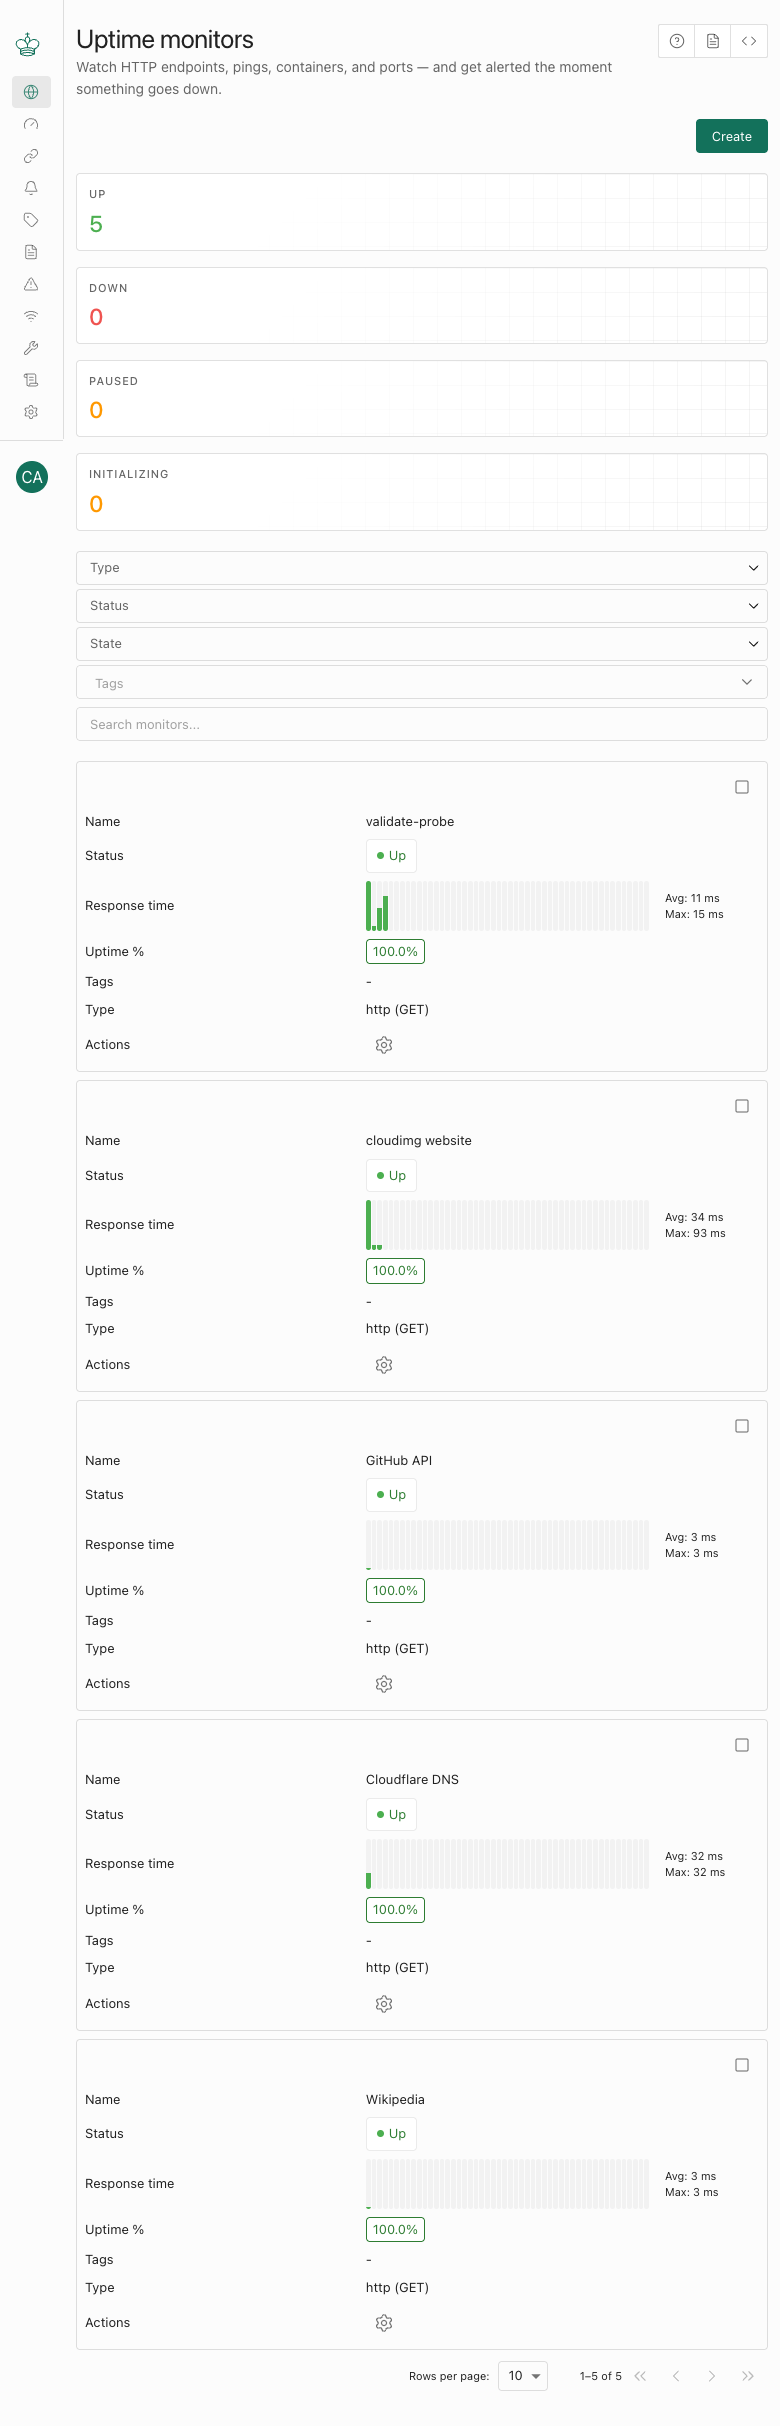
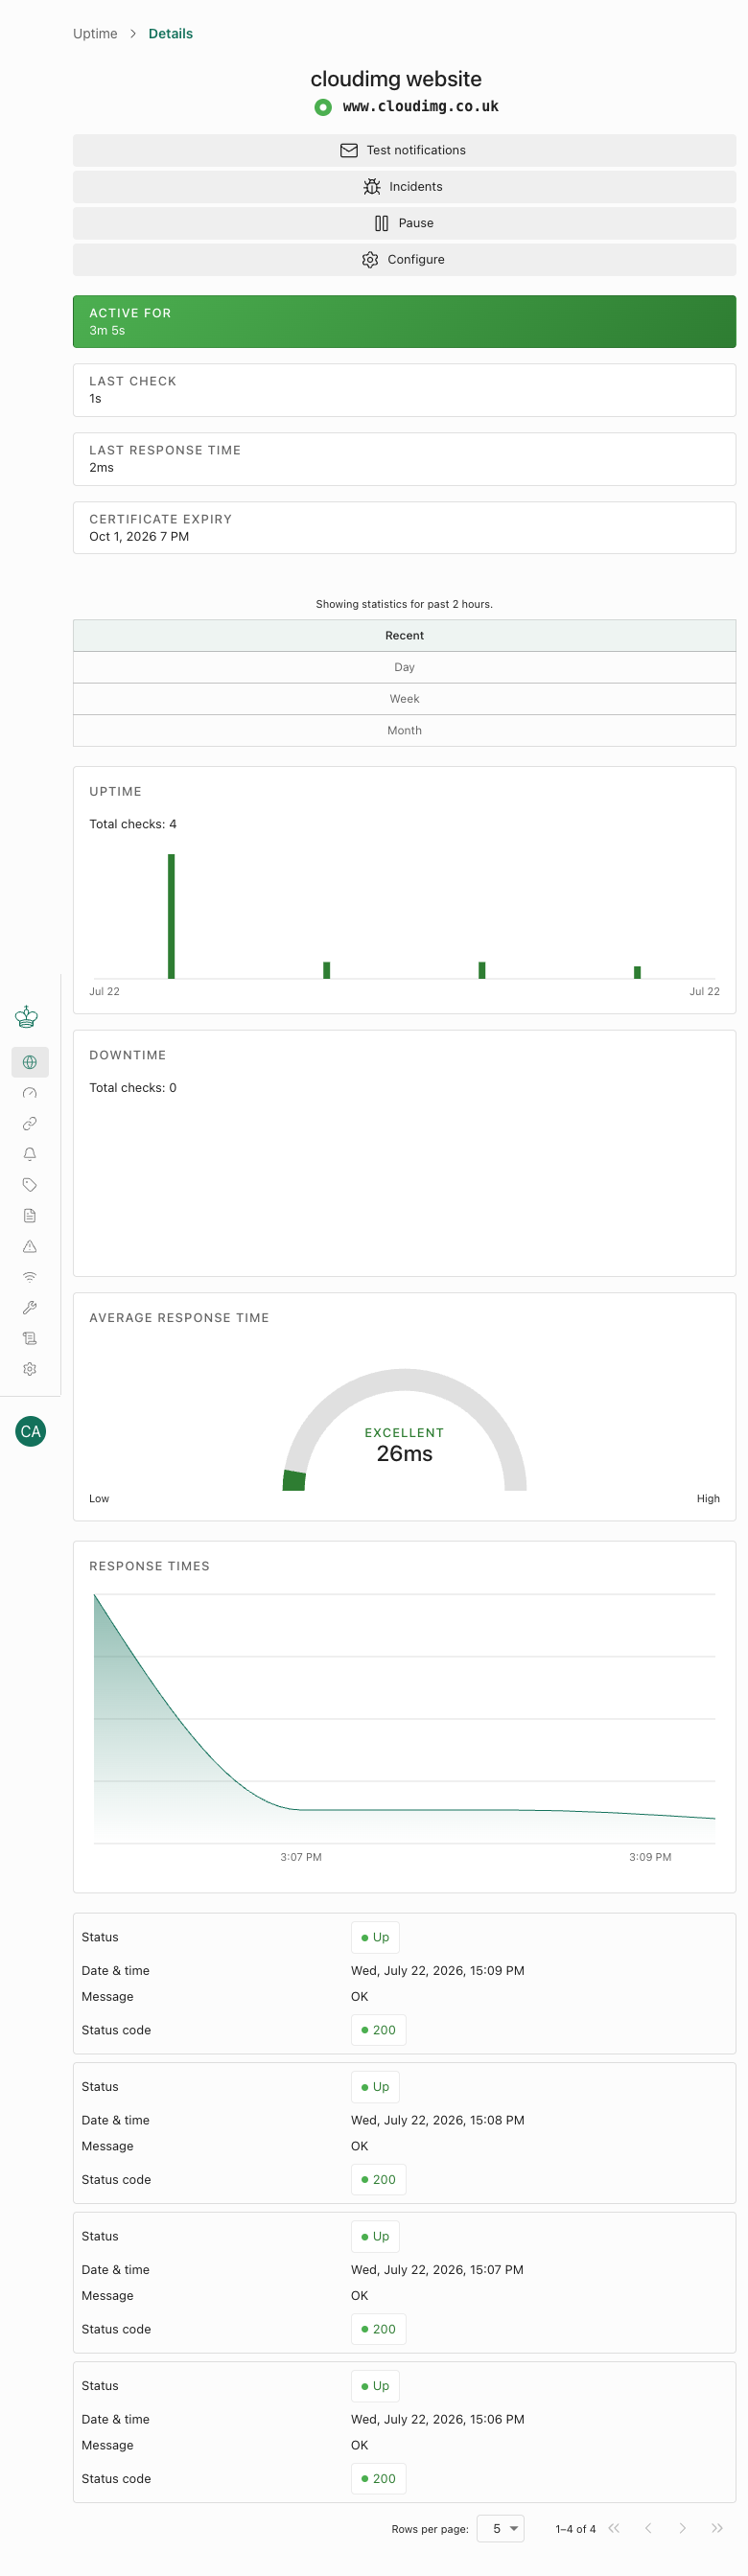
Checkmate is an open source uptime, infrastructure and incident monitoring platform. It continuously checks the availability and response time of your websites, HTTP and REST APIs, TCP ports, ping targets and DNS records, and presents their status, uptime percentage and response time history in a clean React dashboard backed by a REST API. Add a monitor for each endpoint you care about, set the check interval, and Checkmate records every result so you can see current status at a glance, track incidents and publish status pages.
Every instance generates its own JWT signing secret, MongoDB password and administrator password on first boot, stored in a root only file, with self registration closed after the first account so the dashboard is never left open. All monitoring data lives in MongoDB on a dedicated, independently resizable data volume, the database and application server stay bound to loopback behind nginx, and the image ships with a paired step by step deployment guide and 24/7 cloudimg support.
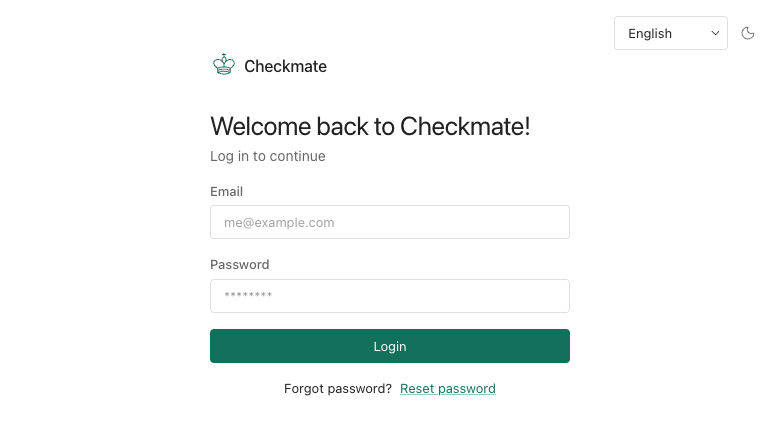
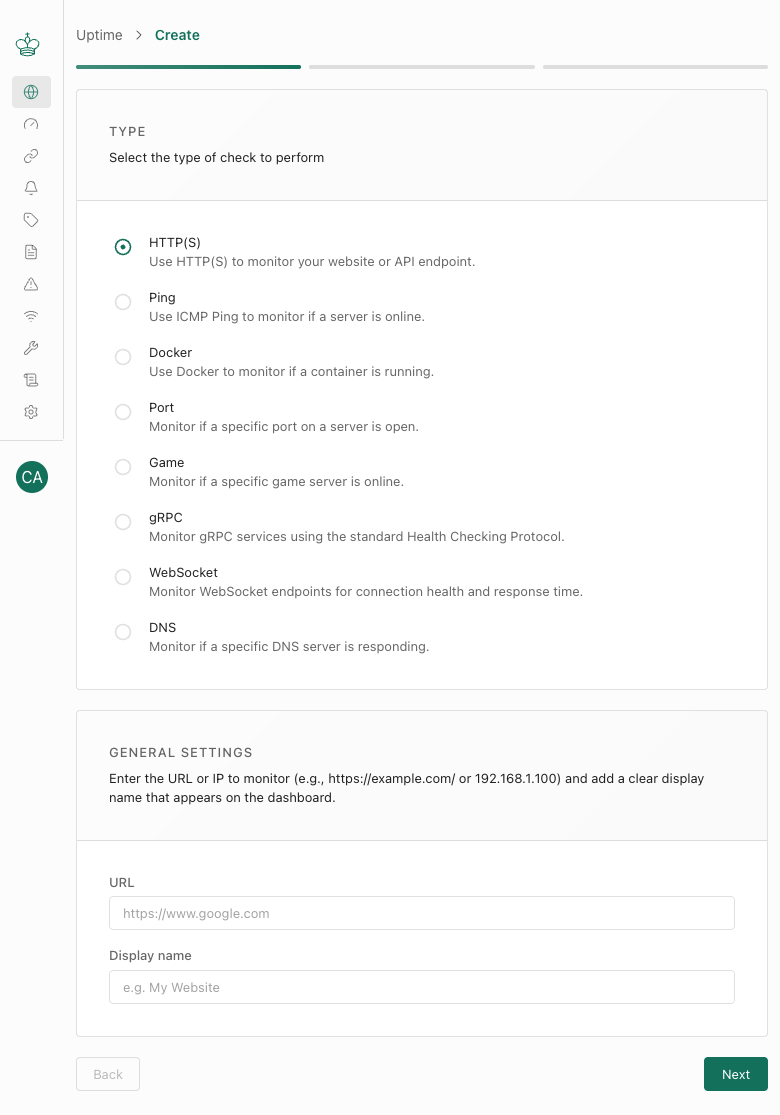
Real screenshots taken while testing this image against its deployment guide.
This is a repackaged open source software product wherein additional charges apply for cloudimg support services.
## Overview
Checkmate (by BlueWave Labs) is an open source uptime, infrastructure and incident monitoring platform. It continuously checks the availability and response time of your websites, HTTP APIs, TCP ports, ping targets and DNS records, and presents their status, uptime percentage and response time history in a clean React dashboard backed by a REST API. Add a monitor for each endpoint you care about, set the check interval, and Checkmate records every result so you see current status at a glance, track incidents and publish status pages. An optional Capture agent extends monitoring to server hardware metrics. The current release available is Checkmate v3.9.2.
## Why Choose This AMI Over Manual Installation
Deploying Checkmate from source requires building the TypeScript server and the React client, provisioning and securing MongoDB, wiring up nginx as a reverse proxy, and generating secrets and the first administrator by hand. This AMI eliminates that work entirely - you launch an instance and sign in. Compared to hosted SaaS monitoring services, a self-hosted deployment in your own VPC gives you full data residency control and avoids per-monitor or per-seat pricing at scale. cloudimg provides ongoing 24/7 support for upgrades, TLS termination, alert integration and database administration - support the open source community project does not offer.
## Application Stack
Checkmate runs bare-metal from the pinned upstream release: the Node.js and Express server is built with TypeScript and reverse-proxied by nginx on port 80, and the React client is served as a static bundle by the same nginx. All monitoring data is stored in a local MongoDB 8.0 on a dedicated, independently resizable EBS volume, with the database bound to loopback. The check queue is MongoDB backed, so there is no separate Redis to run, keeping the appliance lean.
## Secure By Default
The image ships with no default credential. On the first boot of every instance a unique JWT signing secret and MongoDB password are generated at random, MongoDB and the Node server are bound to loopback, and a single administrator is registered with a random per-instance password written to a root-only file. Self registration closes after that first account, so the dashboard is never left open. No shared or default credentials ship in the image, eliminating the default credential exposure common in manual installations.
## Ready To Use
The web server, application server and database are all configured, with the monitoring database on its own dedicated storage volume. Browse to the instance address, sign in as the administrator with the retrieved credentials, and add your first monitor. To evaluate the product at minimal cost, launch on a small instance type and scale up as your monitor count grows. Port 443 is open in the security group for you to add TLS with your own certificate.
## Use Cases
SaaS and DevOps Teams: Monitor dozens of microservice endpoints from a single dashboard. Configure monitors for each service, set check intervals as low as one minute, route alerts to Slack, Telegram, Discord or Webhooks when latency spikes or endpoints go down, and publish a customer-facing status page - all without sending data outside your VPC.
Regulated Industries (Healthcare, Financial Services): Organizations with data residency or compliance requirements can run uptime monitoring entirely within their own AWS account. All check results, incident history and response time data remain on your dedicated EBS volume - no third-party SaaS provider stores or processes your monitoring telemetry.
Internal Infrastructure Teams: Track availability of internal APIs, TCP services and DNS records that are not reachable from external monitoring providers. Combine with the Capture agent for server hardware metrics alongside uptime data.
## Get Started
Launch the AMI, retrieve your unique administrator credentials from the instance, and add your first monitor in under five minutes. To discuss TLS setup, alert integration, capacity planning or a guided deployment walkthrough, contact cloudimg support at any time - we are available 24/7 by email and live chat.
All product and company names are trademarks or registered trademarks of their respective holders. Use of them does not imply any affiliation with or endorsement by them.

This image runs AWStats, the long established open source log file analyser, behind the Apache web server with mod_cgid ...
This image runs CheckCle, the open source self-hosted uptime and infrastructure monitoring platform.
Coroot Community Edition is an open source observability and application performance monitoring (APM) platform built on ...

Gatus pre-configured behind an nginx reverse proxy: an automated health and uptime monitoring dashboard and status page ...

This AMI runs GoAlert 0.34.1, the open source on-call scheduling and alerting platform maintained by Target.

Launch a production-ready OpenTelemetry Collector in minutes - pre-secured with per-instance auth, nginx reverse proxy, ...