Base
Hardened build
minimal ports, security patches applied at build time

Real time monitoring and alerting for servers, databases, middleware and websites, with a live web console.
Apache HertzBeat is an open source, real time monitoring and alerting system. It watches servers, operating systems, databases, message and application middleware, web sites, APIs, TLS certificates and fully custom endpoints, all without installing an agent, and raises alerts through a flexible threshold engine and more than thirty notification channels including email, Slack, Discord, Telegram and webhooks.
It suits teams who want a single, self hosted console to see the health of their infrastructure and services in real time, from one box to a fleet, without wiring together a full metrics stack.
The cloudimg image runs Apache HertzBeat as a dedicated non root service on a self contained single node, using embedded storage for both metadata and metric history so there is no external database to provision. It is secure by default: on first boot the image generates a unique administrator password and a unique token signing secret for the instance, replacing the well known upstream defaults, and writes the admin password to a root only file, so no two instances share a credential and nothing sensitive is baked into the image. The paired deployment guide covers first sign in, adding your first monitor and configuring alerts, and every deployment carries 24/7 support.
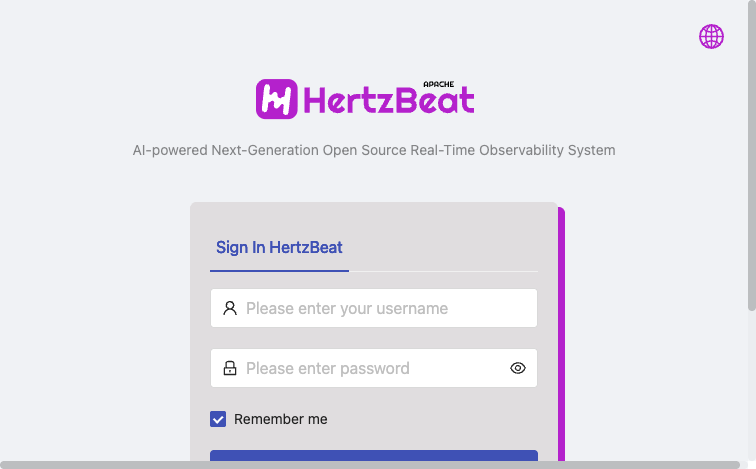
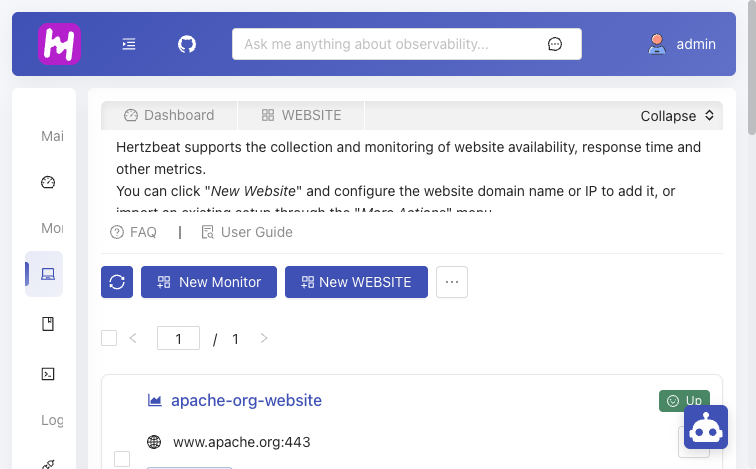
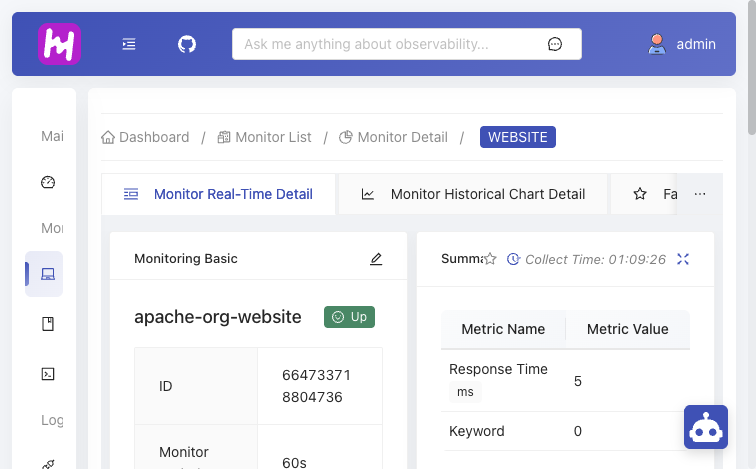
Real screenshots taken while testing this image against its deployment guide.
This is a repackaged open source software product wherein additional charges apply for cloudimg support services.
## Overview
Apache HertzBeat is an open source, real-time monitoring and alerting system from the Apache Software Foundation. It provides agentless monitoring of servers, databases, middleware, web sites, APIs, cloud-native workloads, and custom endpoints - all from a single console with no agents to deploy, no external time-series database to manage, and no multi-component stack to wire together. This AMI delivers HertzBeat fully installed and running so your monitoring console is operational within minutes of launch.
## Why HertzBeat Over Alternative Stacks
Traditional monitoring stacks require you to deploy and maintain multiple components: a metrics collector, a separate time-series database (PostgreSQL, InfluxDB, or Thanos), an alerting engine, and a visualization layer. Each component adds operational burden, failure domains, and cost. HertzBeat eliminates this complexity:
## Evaluation Path
HertzBeat is billed hourly with no long-term commitment. Launch on a t3.small instance to evaluate the full product at minimal cost - the console is live within minutes and you can add monitors immediately. Cancel anytime by terminating the instance.
## Application Stack
HertzBeat runs as a single node using embedded storage: H2 for metadata and DuckDB for metric history, with no external database to provision. It runs under a dedicated unprivileged service account, systemd starts it on boot and restarts it on failure, and the embedded data tier lives on a dedicated data disk that is independently resizable and separate from the operating system disk.
## Secure By Default
There are NO shared default credentials. On first boot the image generates a unique administrator password AND a unique JWT signing secret for your instance, replacing the well-known upstream defaults, and writes the admin password to a file only the root user can read. The operating system is fully security-patched at build time. This eliminates the most common attack vector against self-hosted monitoring tools: unchanged default credentials.
## Monitoring Capabilities
## Concrete Use Case: Spring Boot Microservices on AWS
A DevOps team running 20 Spring Boot microservices on ECS can point HertzBeat at each service's Actuator endpoint to collect JVM heap, garbage collection, and request-latency metrics. Configure a threshold rule to fire when p99 latency exceeds 500ms, route the alert to a Slack channel, and your on-call engineer receives actionable context without deploying a single agent or provisioning Prometheus and Grafana.
## Ready To Use
Open the web console in your browser, read the generated admin password from the instance, sign in, and add your first monitor straight away. A paired step-by-step deployment guide covers first sign-in, adding a monitor, and configuring alerts.
## Get Started
Launch the AMI, sign in to the console, and add your first monitor in minutes. For a guided deployment walkthrough or help designing your monitoring and alerting strategy, contact cloudimg support at any time - we are available 24/7 by email and chat.
## cloudimg Support
24/7 technical support by email and chat. Help with deployment, monitor and alert design, notification-channel integration, storage and retention planning, backup and upgrade planning, and instance sizing.
This is a repackaged open source software product with additional charges for cloudimg support services. Apache HertzBeat, HertzBeat, and Apache are trademarks of The Apache Software Foundation.

This image runs Apache SkyWalking 10.4, an open-source Application Performance Monitoring (APM) and observability platfo...

This image runs AWStats, the long established open source log file analyser, behind the Apache web server with mod_cgid ...

This image runs CheckCle, the open source self-hosted uptime and infrastructure monitoring platform.

Checkmate, by BlueWave Labs, is an open source uptime, infrastructure and incident monitoring platform.

This image delivers Checkmk Raw Edition (the free, 100% open source, GPL-2.0 edition), fully installed and reverse-proxi...
Coroot Community Edition is an open source observability and application performance monitoring (APM) platform built on ...