Base
Hardened build
minimal ports, security patches applied at build time

Tianji, an all in one self hosted insight hub that unifies website analytics, uptime and status monitoring, server telemetry and status pages in a single real time dashboard.
Tianji is an open source, self hosted insight hub that brings website analytics, uptime and status monitoring, server telemetry and public status pages together under one dashboard, so teams can watch everything about their sites and servers from one place instead of running several separate tools. The website analytics are privacy friendly and cookie free, the monitors run scheduled HTTP, TCP and ping checks and keep uptime history, servers push host metrics to a built in reporter, and public status pages share service health with users. It suits developers, operators and small teams who want a single, self owned observability surface for their web properties and infrastructure.
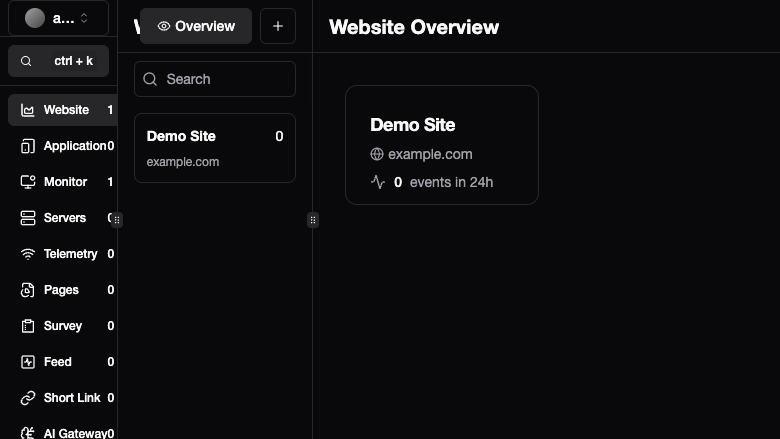
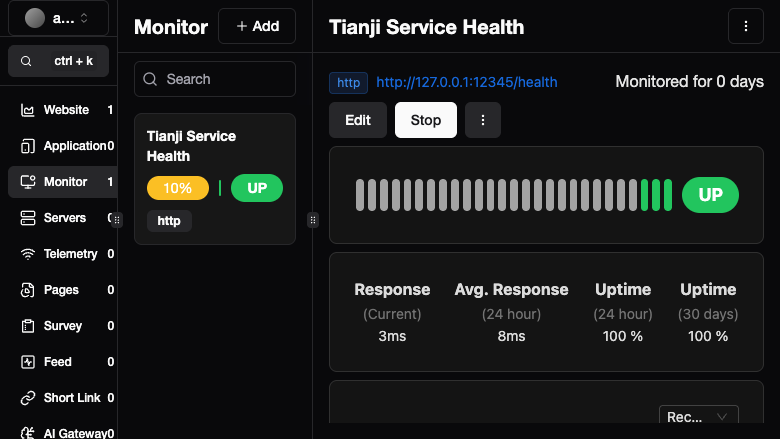
cloudimg ships Tianji as a Node.js server behind an nginx reverse proxy with PostgreSQL, ready on first boot. Tianji's database migration ships a default administrator account, and cloudimg closes that hole: on each instance's first boot the administrator password, the database password and the signing secret are rotated to unique random values written to a root only file, open self registration is disabled, and a demo website and uptime monitor are seeded so the dashboard is a real workspace. It comes with a paired deployment guide and 24/7 cloudimg support.
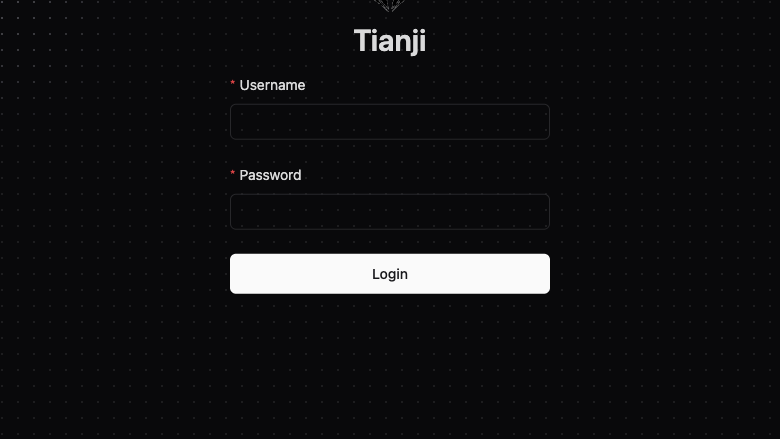
Real screenshots taken while testing this image against its deployment guide.
This is a repackaged open source software product wherein additional charges apply for cloudimg support services.
## Tianji Insight Hub - All-in-One Analytics, Monitoring and Status Pages
Tianji is an open-source, self-hosted insight hub that consolidates website analytics, uptime and status monitoring, server telemetry, and public status pages into a single real-time dashboard. Instead of paying for separate SaaS subscriptions for analytics, uptime checks, and status pages - or spending hours assembling a Node.js runtime, PostgreSQL database, and reverse proxy by hand - this AMI delivers a fully hardened, production-ready Tianji deployment within minutes of launch.
### Who Is This For?
This product is built for small DevOps teams at SaaS companies, solo founders managing multiple projects, and agencies monitoring client sites who need consolidated observability without sending data to third-party services. If you currently juggle separate tools for analytics, uptime monitoring, and incident status communication, Tianji replaces that fragmented stack with one self-hosted dashboard you fully control.
### Why This AMI Instead of Alternatives?
### Example Scenario
A SaaS startup monitoring 20 customer-facing endpoints, collecting privacy-friendly analytics across 3 marketing sites, and publishing a public status page for its users can run all of this from a single Tianji instance. When an endpoint goes down, the built-in notification channels alert the on-call engineer while the status page updates automatically - no context-switching between tools.
### Application Stack
The Tianji Node.js server runs as a dedicated unprivileged system user bound to the loopback interface, reverse-proxied behind nginx on port 80 with WebSocket support for the real-time dashboard. PostgreSQL provides durable state. The database tier and the Tianji application tree each live on their own dedicated, independently resizable EBS data disk - separated from the OS disk - so data survives instance replacement and storage can be scaled without downtime.
### Secure First Boot
On every first boot, a one-shot service:
No shared or default password ever ships in the image. There is no known default administrator login.
### One Dashboard For Everything
Privacy-friendly website analytics, HTTP/TCP/ping uptime monitors, server telemetry reporting, and public status pages are all built in. Add a website to collect analytics, add a monitor to watch an endpoint, configure notification channels for alerts, publish a status page for your users, and see it all on one real-time dashboard.
### Ready To Use
Browse to the instance on port 80, sign in with the generated administrator credentials (found in the root-only credentials file), and start adding sites and monitors. systemd manages Tianji, nginx, and PostgreSQL for automatic restarts and clean logging. The operating system is fully patched at build time and receives unattended security updates.
### 24/7 cloudimg Support Included
Expert technical support by email and live chat covers deployment, website analytics setup, uptime and status monitor configuration, status pages, notification channels, server telemetry, version upgrades, performance tuning, and PostgreSQL database administration.
This is a repackaged open-source software product with additional charges for cloudimg support services. All product and company names are trademarks or registered trademarks of their respective holders. Use of them does not imply any affiliation with or endorsement by them.

This image runs Apache HertzBeat, the open source real-time monitoring and alerting system from the Apache Software Foun...

This image runs Apache SkyWalking 10.4, an open-source Application Performance Monitoring (APM) and observability platfo...

This image runs CheckCle, the open source self-hosted uptime and infrastructure monitoring platform.

Checkmate, by BlueWave Labs, is an open source uptime, infrastructure and incident monitoring platform.

This image runs AWStats, the long established open source log file analyser, behind the Apache web server with mod_cgid ...

This image delivers Checkmk Raw Edition (the free, 100% open source, GPL-2.0 edition), fully installed and reverse-proxi...